Author name: Ramesh Banjade

lBusiness Intelligence Developer with a demonstrated history of working in the banking industry. My area of expertise is centered around the use of cutting-edge tools and technologies, including Power BI, SQL, SQL Server Reporting Services (SSRS), SSAS, Python, Machine Learning, and Predictive Modeling to extract meaningful insights from data and facilitate informed decision making and business growth. Ramesh Banjade Business Intelligence Developer Ramesh Banjade | LinkedIn

Statistical Analysis for Analysts: Maximizing Data driven Insights and Decision Making

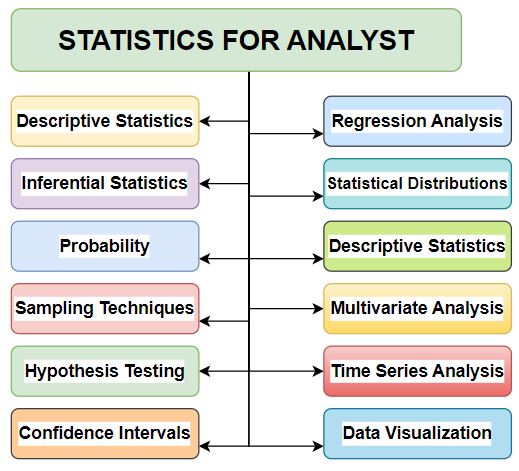
Understanding Statistical Analysis technique and concept helps the data analyst to unlock the potential of data-driven insights, make informed decisions, and effectively communicate findings through visual representations. Following are the some important statistical techniques.   Descriptive Statistics Analysis Descriptive statistics involves summarizing and describing data using measures such as central tendency (mean, median, mode )

Statistical Analysis for Analysts: Maximizing Data driven Insights and Decision Making Read More »

Introduction to SQL and the Fundamental Structure of SQL Statements

SQL Stands for Structure Query Language. It is an ANSI (American National Standard Institute)  Standard. SQL is a database programming language used for manipulating and managing relational database Users can create complex queries and perform complex tasks efficiently using SQL and it is an essential tool for data management, analysis and reporting in various industries

Introduction to SQL and the Fundamental Structure of SQL Statements Read More »

The Power of Better Data Understanding and Presentation in Driving Organizational Success

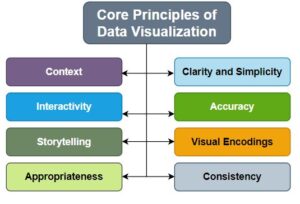
Data literacy remains a significant challenge for organizations, but there is a lot of space for improvement. Power BI and similar technologies can contribute to addressing this issue, but they are not the sole solution. It is crucial not to overlook the importance of a well-thought-out data strategy. Treating your organization’s data without proper planning

The Power of Better Data Understanding and Presentation in Driving Organizational Success Read More »

Components of Power BI – Power Query, Power Pivot and Power View

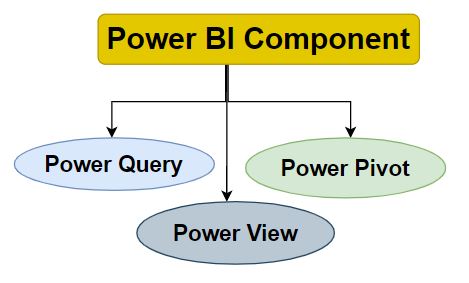
Power Query, Power Pivot, And Power View Are Three Components Of Microsoft’s Power BI Suite, Which Is A Collection Of Business Intelligence Tools For Data Analysis And Visualization. Power Query Power Query is a data connectivity and transformation tool. it allows users to extract data from various sources, transform and clean it, and load Data

Components of Power BI – Power Query, Power Pivot and Power View Read More »

Microsoft Power BI June 2023 Update

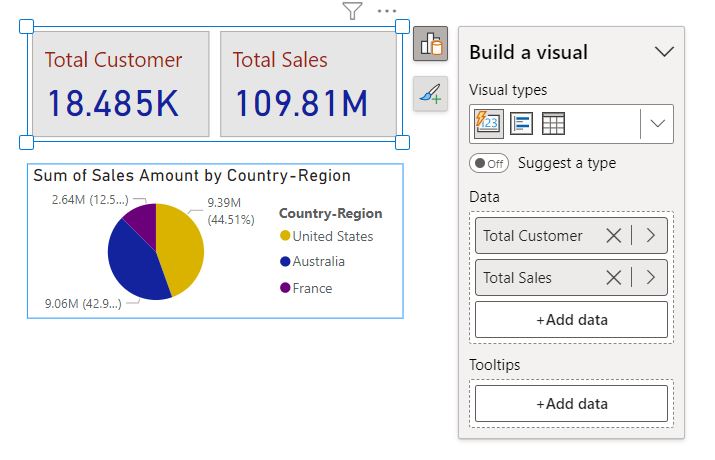
Introduction Microsoft Power BI is a most popular and widely used business intelligence tool that empowers users to visualize and analyze data efficiently. With its intuitive interface and powerful features, Power BI offers several advantages. One key feature is its ability to connect to diverse data sources, including databases and cloud services. This allows users

Microsoft Power BI June 2023 Update Read More »

The Rise of Autonomous AI Agents: Revolutionizing Automation

Autonomous AI agents have emerged as game-changers in the world of automation .Autonomous AI agents are computer systems that can gather information from their surroundings and independently make decisions on how to achieve specific goals. These agents can handle complex tasks by using various models and tools such as language, code, video, speech, search engines,

The Rise of Autonomous AI Agents: Revolutionizing Automation Read More »

Scroll to Top