Clean • Transform • Validate • Prepare
Data rarely arrives ready for analysis. Real-world datasets can contain duplicate records, inconsistent text, missing values, incorrect data types, errors, unnecessary columns, and different structures across files.
In this tutorial, you will learn how to use Power Query to build a reliable, repeatable data-cleaning process before your data enters the Power BI data model.
Professional principle: Do not clean data simply to make it “look right.” Clean it according to the meaning and rules of the business data.
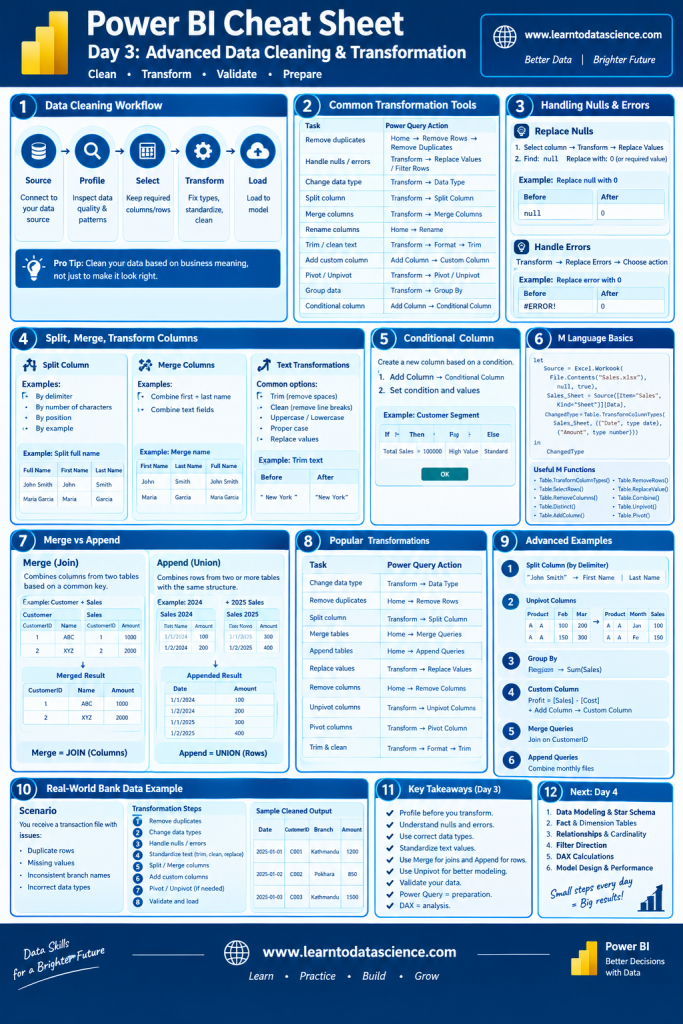
1. Why Data Cleaning Matters
A Power BI report is only as trustworthy as the data behind it.
Consider this customer dataset:
| Customer ID | Customer Name | Country | Status |
|---|---|---|---|
| C001 | John Smith | USA | Active |
| C002 | Maria Garcia | Spain | Active |
| C003 | John Smith | USA | Active |
| C001 | John Smith | USA | Active |
At first glance, the last two records may appear to be duplicates.
But are they?
Not necessarily.
Customer ID = C001 appearing twice could mean:
- Duplicate records
- Multiple source-system extracts
- Historical records
- Different versions of the customer
- A legitimate one-to-many relationship
Therefore:
Never remove duplicates without understanding what makes a record unique.
This principle is much more important than simply knowing where the Remove Duplicates button is.
2. The Professional Data-Cleaning Workflow
A reliable Power Query workflow can be structured like this:
SOURCE
  ↓
PROFILE
  ↓
SELECT REQUIRED DATA
  ↓
FIX DATA TYPES
  ↓
STANDARDIZE VALUES
  ↓
HANDLE NULLS & ERRORS
  ↓
REMOVE INVALID / DUPLICATE RECORDS
  ↓
RESHAPE DATA
  ↓
CREATE REQUIRED COLUMNS
  ↓
VALIDATE RESULTS
  ↓
LOAD TO MODEL
The order is important.
For example, it is usually better to understand the source and establish the correct data types before performing complex transformations.
3. Step 1 — Profile Your Data Before Changing It
Before transforming anything, inspect the data.
In Power Query, use the View tab and enable features such as:
- Column quality
- Column distribution
- Column profile
These can help identify:
- Empty values
- Errors
- Unexpected values
- Number of distinct values
- Number of unique values
- Distribution of values
Example
Suppose a Country column contains:
USA
USA
United States
United States
U.S.A.
UK
United Kingdom
Germany
Power Query may correctly see these as different text values.
But from a business perspective, some may represent the same country.
That is a data-standardization problem, not a duplicate-removal problem.
4. Step 2 — Remove Unnecessary Columns
Do not carry unnecessary columns through your entire query.
Suppose a sales file contains:
TransactionID
TransactionDate
CustomerID
ProductID
Quantity
SalesAmount
CustomerName
CustomerEmail
InternalNote
TemporaryImportFlag
UnusedColumn1
UnusedColumn2
If the report does not require InternalNote, TemporaryImportFlag, or unused columns, remove them.
Why?
Reducing unnecessary columns can:
- Simplify the query
- Reduce model size
- Improve maintainability
- Make the final model easier to understand
Important distinction
Remove columns when the fields are unnecessary.
Do not remove columns simply because they currently contain many blank values.
A mostly blank column may still have important business meaning.
5. Step 3 — Set Correct Data Types
Correct data types are fundamental.
Consider:
Order Date
01/02/2026
02/02/2026
03/02/2026
If the column is imported as text, date calculations may fail or behave unexpectedly.
Typical types include:
| Data | Recommended Type |
|---|---|
| Customer ID | Text |
| Product Code | Text |
| Customer Name | Text |
| Order Date | Date |
| Order Date & Time | Date/Time |
| Quantity | Whole Number |
| Sales Amount | Decimal Number |
| Discount % | Decimal Number |
| Is Active | True/False |
Important: IDs Are Usually Text
This is a common beginner mistake.
Suppose:
Customer ID
000001
000002
000003
Do not automatically convert this to a number.
If converted to a whole number:
1
2
3
the leading zeros disappear.
For identifiers, Text is often the appropriate data type even when the value contains only digits.
6. Step 4 — Handle Nulls Carefully
A null value means the value is missing or unknown.
It does not automatically mean zero.
For example:
| Product | Sales |
|---|---|
| A | 500 |
| B | null |
| C | 300 |
Should null become 0?
It depends.
Case 1 — Null means no sales
If the source system explicitly defines missing sales as zero, replacement may be appropriate.
Case 2 — Null means unknown
Replacing it with zero would change the meaning of the data.
The correct approach may be to keep it as null or investigate the source.
Professional rule
Never replace null with zero without understanding the business meaning of null.
7. Step 5 — Handle Errors
Power Query may display errors when:
- Text is converted to a number
- Invalid dates are converted to Date
- A calculation encounters invalid values
- A source contains malformed records
Example:
Sales Amount

1000
2500
N/A
500
Converting the column to a number can produce an error for N/A.
You have several choices:
Option A — Replace the error
Use:
Transform → Replace Errors
Option B — Remove error rows
Use:
Home → Remove Rows → Remove Errors
Option C — Fix the source value
This is often the best solution when the source system contains invalid data.
Do not automatically remove errors. First determine why they exist.
8. Step 6 — Standardize Text
Text inconsistencies are extremely common.
Example:
New York
new york
NEW YORK
New York
 New York
These may represent the same location.
Useful transformations include:
Trim
Removes leading and trailing spaces.
" New York " → "New York"
Clean
Removes certain non-printing characters.
Uppercase
usa → USA
Lowercase
USA → usa
Proper Case
john smith → John Smith
However, be careful with proper case.
For example:
IBM
McDonald's
eBay
USA
Blindly applying Proper Case can produce undesirable results.
Standardization should follow the business’s approved naming convention.
9. Step 7 — Replace Values Carefully
Suppose your data contains:
United States
USA
U.S.
US
You may want to standardize them to:
United States
This can be done with Replace Values, but for large datasets, a dedicated mapping table can be more maintainable.
Example mapping table
| Source Value | Standard Value |
|---|---|
| USA | United States |
| US | United States |
| U.S. | United States |
| United States | United States |
This approach is particularly useful when the list of variations grows.
10. Step 8 — Split Columns
Suppose:
Full Name
John Smith
Maria Garcia
David Lee
You can split the column into:
First Name | Last Name
John       | Smith
Maria      | Garcia
David      | Lee
Use:
Transform → Split Column
Possible methods include:
- By delimiter
- By number of characters
- By positions
- By examples
Important warning
Splitting names by the first space is not universally reliable.
Consider:
Maria de la Cruz
John van der Meer
A simple first-space split may not produce the intended first and last names.
Use structural rules only when the source data supports them.
11. Step 9 — Merge Columns
You can also combine multiple columns.
Example:
First Name | Last Name
John       | Smith
into:
Full Name
John Smith
Use:
Transform → Merge Columns
Choose an appropriate separator such as a space.
12. Step 10 — Conditional Columns
A Conditional Column creates values based on business rules.
Suppose:
| Customer | Annual Sales |
|---|---|
| A | 150000 |
| B | 25000 |
| C | 90000 |
You want:
Annual Sales > 100000 → High Value
Otherwise             → Standard
Use:
Add Column → Conditional Column
Result:
| Customer | Annual Sales | Customer Segment |
|---|---|---|
| A | 150000 | High Value |
| B | 25000 | Standard |
| C | 90000 | Standard |
Important
A classification threshold should come from a defined business rule, not an arbitrary number chosen only for demonstration.
13. Custom Columns
A Custom Column allows you to create a formula using Power Query’s M language.
Example:
SalesAmount - CostAmount
could create:
Profit
A simple M expression could be:
[SalesAmount] - [CostAmount]
Another example:
[Quantity] * [UnitPrice]
creates:
Gross Sales
Power Query vs DAX
If the value is fundamentally part of data preparation, Power Query may be appropriate.
If it needs to respond dynamically to report filters, a DAX measure is generally more appropriate.
14. Pivot and Unpivot
These transformations are extremely important when working with poorly structured spreadsheets.
Pivot
Suppose the data is:
| Month | Product | Sales |
|---|---|---|
| Jan | A | 100 |
| Jan | B | 200 |
| Feb | A | 150 |
| Feb | B | 250 |
Pivoting can turn values into columns.
Month | A | B
Jan   |100|200
Feb   |150|250
Unpivot
Suppose a spreadsheet contains:
| Product | Jan | Feb | Mar |
|---|---|---|---|
| A | 100 | 150 | 200 |
| B | 200 | 250 | 300 |
For analytical modeling, this wide format is often better transformed into:
| Product | Month | Sales |
|---|---|---|
| A | Jan | 100 |
| A | Feb | 150 |
| A | Mar | 200 |
| B | Jan | 200 |
| B | Feb | 250 |
| B | Mar | 300 |
Use:
Transform → Unpivot Columns
Why Unpivot Matters
Power BI generally works well with normalized, tabular structures.
When a spreadsheet stores categories as columns, ask whether those columns should become rows.
15. Group By
Group By summarizes data in Power Query.
Suppose:
| Region | Sales |
|---|---|
| North | 1000 |
| North | 2000 |
| South | 1500 |
| South | 2500 |
Group by Region and calculate Sum:
| Region | Total Sales |
|---|---|
| North | 3000 |
| South | 4000 |
Possible aggregations include:
- Sum
- Average
- Minimum
- Maximum
- Count Rows
- Count Distinct Rows
Important modeling consideration
Do not aggregate data unnecessarily before loading it into the model.
If you need transaction-level analysis later, grouping the transaction table may destroy useful detail.
16. Merge Queries: A Real Modeling Example
Suppose you have:
Sales
| ProductID | Sales |
|---|---|
| P001 | 1000 |
| P002 | 2000 |
Product
| ProductID | Product Name | Category |
|---|---|---|
| P001 | Laptop | Electronics |
| P002 | Chair | Furniture |
You can merge Sales with Product using:
ProductID
Result:
| ProductID | Sales | Product Name | Category |
|---|---|---|---|
| P001 | 1000 | Laptop | Electronics |
| P002 | 2000 | Chair | Furniture |
But should you always merge?
No.
If the final Power BI model should use a star schema, it may be better to keep:
FactSales
     ↓
DimProduct
and create a relationship between the tables.
This is an important distinction:
Power Query Merge is a data-transformation operation. A model relationship is a data-modeling operation.
17. Append Queries: Monthly Files
Suppose you receive:
Sales_January.xlsx
Sales_February.xlsx
Sales_March.xlsx
and each file has the same structure.
Instead of creating three separate datasets manually, you can append the tables.
January
   +
February
   +
March
   ↓
Sales
Result:
Sales
──────────────
January rows
February rows
March rows
Critical requirement
The tables should have compatible structures.
Before appending, verify:
- Column names
- Data types
- Column meanings
- Required fields
Similar column names do not necessarily mean identical business meaning.
18. Handling Multiple Files
For recurring files, Power Query can use the Folder connector.
Example:
Sales/
 ├── Sales_2026_01.xlsx
 ├── Sales_2026_02.xlsx
 ├── Sales_2026_03.xlsx
 └── Sales_2026_04.xlsx
Instead of manually importing each file, Power Query can combine files using a repeatable transformation process.
This is extremely useful for:
- Monthly sales files
- Daily transaction exports
- Branch reports
- Operational logs
- Recurring CSV files
The goal is:
New File
   ↓
Drop into Folder
   ↓
Refresh Power BI
   ↓
Automatically Process
This is one of the biggest productivity benefits of Power Query.
19. Query Folding
For professional Power BI development, query folding is an important concept.
When Power BI connects to a source such as SQL Server, some Power Query transformations can be translated into operations performed by the source database.
Conceptually:
Power Query Transformation
          ↓
      Query Folding
          ↓
     SQL Server
          ↓
   Smaller Result Set
          ↓
       Power BI
For example, filtering rows at the source can reduce the amount of data transferred to Power BI.
Why it matters
Query folding can improve:
- Refresh performance
- Source utilization
- Network efficiency
- Scalability
Important
Not every transformation folds.
Always consider the capabilities of the specific connector and source.
20. Applied Steps: Think Like a Developer
Applied Steps are more than a history list.
They represent a transformation pipeline.
Example:
Source
 ↓
Navigation
 ↓
Removed Columns
 ↓
Changed Type
 ↓
Filtered Rows
 ↓
Replaced Values
 ↓
Added Custom
When designing a professional query, ask:
Does every step have a purpose?
Avoid unnecessary steps such as repeatedly renaming, changing types, and transforming the same column without reason.
A simpler query is usually easier to:
- Understand
- Debug
- Maintain
- Reuse
21. M Language: Understanding the Generated Code
Power Query uses the M language.
A typical query has this structure:
let
    Source = ...,
    ChangedType = ...,
    FilteredRows = ...
in
    FilteredRows
Each step normally refers to the previous step.
For example:
let
    Source = Excel.Workbook(File.Contents("Sales.xlsx"), null, true),
    Sales = Source{[Item="Sales",Kind="Sheet"]}[Data],
    ChangedType = Table.TransformColumnTypes(
        Sales,
        {{"SalesAmount", type number}}
    )
in
    ChangedType
You do not need to write all M code manually.
A strong Power BI developer should, however, understand enough M to:
- Read generated code
- Debug transformations
- Modify expressions
- Create reusable logic
- Understand what Power Query is doing
22. Validation: The Step Many Beginners Skip
After cleaning the data, validate the result.
Ask:
Row Count
Did the number of records change unexpectedly?
Before: 1,000,000 rows
After:    750,000 rows
If 250,000 rows disappeared, you need to know why.
Duplicate Count
Did duplicate removal remove legitimate records?
Null Count
Did missing values increase or decrease unexpectedly?
Totals
Does the total sales amount still reconcile with the source?
Source Total Sales = 25,450,000
Cleaned Total Sales = 25,450,000
If the totals differ, investigate.
Date Range
Check:
Minimum Date
Maximum Date
Unexpected dates can indicate source problems.
23. A Professional Data Quality Checklist
Before loading data into your model, verify:
| Check | Question |
|---|---|
| Completeness | Are required fields populated? |
| Accuracy | Are values valid? |
| Consistency | Are values standardized? |
| Uniqueness | Are keys duplicated unexpectedly? |
| Validity | Are data types and formats correct? |
| Timeliness | Is the data period correct? |
| Reconciliation | Do important totals match the source? |
This transforms Power Query from a simple cleaning tool into part of a data-quality process.
24. Power Query vs DAX — Advanced Decision Guide
| Requirement | Prefer |
|---|---|
| Remove duplicates | Power Query |
| Clean text | Power Query |
| Change data type | Power Query |
| Split a source column | Power Query |
| Combine source files | Power Query |
| Standardize source values | Power Query |
| Create reusable transformation | Power Query |
| Dynamic KPI | DAX |
| YTD Sales | DAX |
| Sales vs Previous Year | DAX |
| Percentage of Total | DAX |
| Calculation responding to slicers | DAX |
Simple principle
Power Query prepares the data. DAX analyzes the data.
There are exceptions and advanced modeling scenarios, but this is an excellent starting rule.
25. End-to-End Practice Project
Use a fictional global retail dataset containing:
TransactionID
TransactionDate
CustomerID
ProductID
ProductName
Category
Country
Quantity
UnitPrice
Discount
SalesAmount
Your objective is to prepare it for a Power BI sales dashboard.
Step 1 — Profile
Identify:
- Nulls
- Errors
- Duplicate IDs
- Unexpected categories
- Incorrect data types
Step 2 — Remove Unnecessary Fields
Keep only fields required for analysis.
Step 3 — Correct Data Types
Set:
TransactionID → Text
TransactionDate → Date
CustomerID → Text
ProductID → Text
Quantity → Whole Number
UnitPrice → Decimal Number
Discount → Decimal Number
SalesAmount → Decimal Number
Step 4 — Standardize Text
Trim:
Country
Category
ProductName
Investigate inconsistent country/category values.
Step 5 — Handle Missing Data
Do not automatically replace every null.
For each field, determine:
Is missing = unknown?
Is missing = zero?
Is missing = not applicable?
Is missing = data-quality problem?
Step 6 — Validate Duplicates
Determine whether TransactionID should be unique.
If yes, investigate duplicates before removing them.
Step 7 — Create Business Columns
For example:
SalesAmount
CostAmount
Profit
Only create these in Power Query if they are part of the appropriate data-preparation layer.
Step 8 — Validate
Compare:
Row Count
Transaction Count
Sales Total
Date Range
Missing Values
with the source.
Step 9 — Load
Use:
Home → Close & Apply
The cleaned dataset is now ready for the modeling stage.
26. Common Mistakes to Avoid
❌ Replacing every null with zero
Null does not always mean zero.
❌ Removing duplicates blindly
Two identical-looking rows may represent legitimate transactions.
❌ Converting IDs to numbers
Identifiers such as 000123 can lose meaningful formatting.
❌ Using Power Query for every calculation
Dynamic analytical calculations usually belong in DAX.
❌ Loading unnecessary columns
Extra data increases complexity and can increase model size.
❌ Ignoring query folding
Large source datasets can suffer from inefficient refresh processes.
❌ Not validating after transformations
A query can successfully refresh while still producing incorrect results.
❌ Assuming all country names follow one format
International datasets often contain different naming conventions, abbreviations, and localization issues.
27. Day 3 Professional Takeaways
Remember these principles:
Profile before you transform.
Understand the meaning of null before replacing it.
Understand the business key before removing duplicates.
Treat identifiers as identifiers, not automatically as numbers.
Use Merge for joining related data and Append for combining compatible rows.
Use Unpivot to convert spreadsheet-style wide data into analytical structures when appropriate.
Validate row counts and important totals after major transformations.
Use Power Query for preparation and DAX for dynamic analysis.
Build transformations that can run again automatically during refresh.
28. Day 3 Challenge
Create a Power BI query that processes a messy sales dataset and document the following:
- Source structure
- Data-quality problems found
- Data types selected
- Duplicate-handling rule
- Null-handling rule
- Text-standardization approach
- Transformations performed
- Merge or Append decisions
- Validation checks
- Final result
Bonus Challenge
Create a data-quality summary containing:
Total Rows
Valid Rows
Duplicate Rows
Error Rows
Null Rows
Minimum Date
Maximum Date
Total Sales
This turns a basic Power Query exercise into a small professional data-preparation project.
What You Should Know After Day 3
By completing this tutorial, you should be able to:
- Profile raw data
- Identify data-quality issues
- Select appropriate data types
- Handle nulls and errors responsibly
- Standardize inconsistent text
- Split and merge columns
- Create conditional and custom columns
- Pivot and unpivot data
- Group and aggregate data
- Merge and append queries
- Process recurring files
- Understand the fundamentals of query folding
- Read basic M code
- Validate transformed data
- Decide when to use Power Query versus DAX
Coming Next — Day 4
Data Modeling and Star Schema
In Day 4, we move from clean data to a professional Power BI data model.
You will learn:
Fact Tables → Dimension Tables → Relationships → Cardinality → Filter Direction → Star Schema → Date Dimension → Model Design → Performance
The goal is not just to make a report work—it is to build a model that is accurate, scalable, maintainable, and ready for professional Power BI development.
Power BI Cheat Sheet Series
Day 1: Power BI Fundamentals
Day 2: Power Query Fundamentals
Day 3: Advanced Data Cleaning & Transformation
Day 4: Data Modeling & Star Schema
Learn • Practice • Build • Grow
Microsoft Official Page : Download Power BI Desktop