Get → Transform → Clean → Shape Your Data
Power Query is one of the most important components of Power BI. It is used to connect to data sources, clean and transform raw data, and prepare it before the data is loaded into the Power BI data model.
Simple rule: Clean and transform data with Power Query; calculate and analyze data with DAX.
1. What Is Power Query?
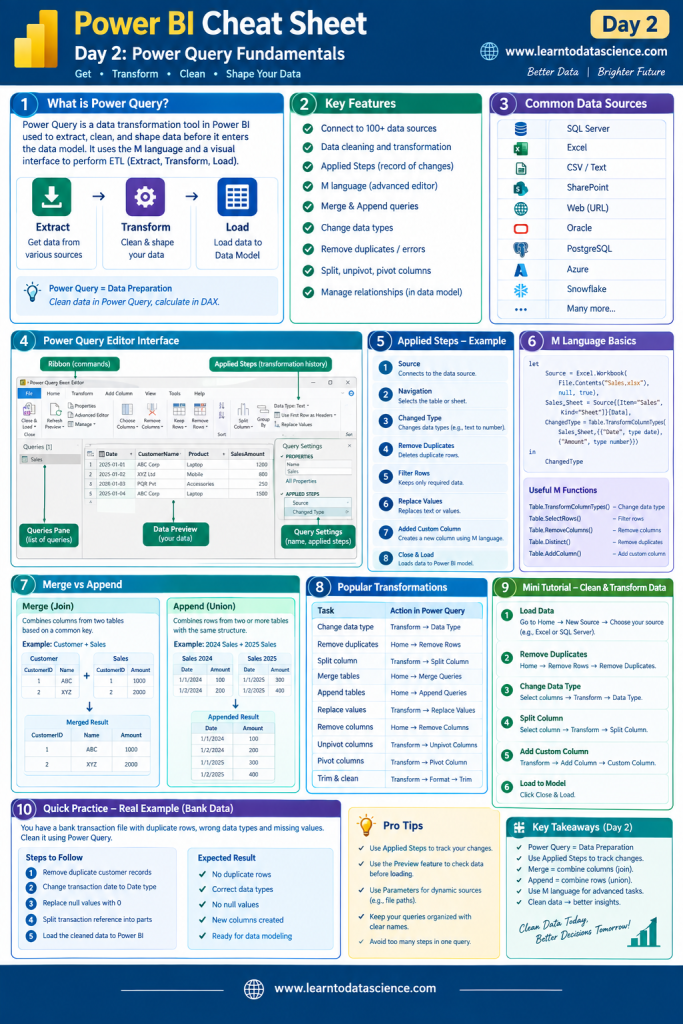
Power Query is Power BI’s data preparation and transformation engine. It follows the ETL concept:
Extract → Transform → Load
Data Sources
     ↓
   Extract
     ↓
  Transform
     ↓
     Clean
     ↓
     Shape
     ↓
 Power BI Data Model
For example, a bank may receive transaction data containing duplicate records, incorrect data types, blank values, and inconsistent branch names. Power Query can clean these problems before the data enters the model.
2. What Can Power Query Do?
Power Query can perform many common data-preparation tasks:
- Remove duplicate records
- Remove errors and null values
- Change data types
- Rename columns
- Remove unnecessary columns
- Split columns
- Merge columns
- Replace values
- Filter rows
- Sort data
- Group data
- Merge queries
- Append queries
- Pivot columns
- Unpivot columns
- Add custom columns
- Extract information from text and dates
Power Query supports a large number of data sources, including SQL Server, Excel, CSV, Oracle, PostgreSQL, SharePoint, Web APIs, Azure, Snowflake, and many others.
3. Power Query Editor
In Power BI Desktop, Power Query can be opened from:
Home → Transform data
The Power Query Editor contains several important areas:
Queries Pane
Shows the queries/tables you are working with.
Ribbon
Contains transformation commands such as:
- Home
- Transform
- Add Column
- View
- Tools
Data Preview
Shows a preview of your data and allows you to select columns and rows.
Query Settings
Contains:
- Properties
- Applied Steps
Applied Steps
Applied Steps are extremely important because Power Query records the transformations you perform.
For example:
Source
   ↓
Navigation
   ↓
Changed Type
   ↓
Removed Duplicates
   ↓
Filtered Rows
   ↓
Replaced Values
   ↓
Added Custom Column
   ↓
Close & Load
You can click an earlier step to see the data at that stage.
4. Applied Steps
Suppose your transaction table contains duplicate transactions.
You can:
Home → Remove Rows → Remove Duplicates
Power Query creates an Applied Step such as:
Removed Duplicates
This means the transformation is recorded and will automatically run again when the data is refreshed.
Why is this useful?
You don’t have to manually clean the data every time new data arrives.
First Refresh:
Raw Data → Transformations → Clean Data

Next Refresh:
New Raw Data → Same Transformations → Clean Data
5. Changing Data Types
Correct data types are essential for reliable Power BI reports.
Common data types include:
| Data | Recommended Type |
|---|---|
| Customer Name | Text |
| Transaction Date | Date |
| Transaction Amount | Decimal Number |
| Quantity | Whole Number |
| Interest Rate | Decimal Number |
| Account Active | True/False |
Example:
Transaction Date
2026-01-01
2026-01-02
2026-01-03
should be stored as a Date, not Text.
To change it:
Select Column → Transform → Data Type → Date
6. Merge vs Append
This is one of the most important Power Query concepts.
Merge = Join Columns
Merge combines two tables based on a matching key.
Example:
Customer Table
CustomerID | Name
1          | ABC
2          | XYZ

Sales Table
CustomerID | Amount
1          | 1000
2          | 2000
Merge can produce:
CustomerID | Name | Amount
1          | ABC  | 1000
2          | XYZ  | 2000
Think:
Merge = SQL JOIN
Append = Combine Rows
Append combines tables with the same or similar columns.
Example:
Sales 2025
Date       | Amount
01-Jan     | 100
02-Jan     | 200

Sales 2026
Date       | Amount
01-Jan     | 300
02-Jan     | 400
After Append:
Date       | Amount
01-Jan     | 100
02-Jan     | 200
01-Jan     | 300
02-Jan     | 400
Think:
Append = UNION
Easy Memory Trick
Merge → Columns / JOIN
Append → Rows / UNION
7. Common Power Query Transformations
| Requirement | Power Query Action |
|---|---|
| Change data type | Transform → Data Type |
| Remove duplicates | Home → Remove Rows |
| Remove columns | Home → Remove Columns |
| Split a column | Transform → Split Column |
| Replace values | Transform → Replace Values |
| Filter records | Filter dropdown |
| Combine tables by key | Merge Queries |
| Combine tables vertically | Append Queries |
| Create calculated column | Add Column |
| Remove extra spaces | Transform → Format → Trim |
| Convert text case | Transform → Format |
| Convert rows to columns | Pivot |
| Convert columns to rows | Unpivot |
8. M Language
Power Query transformations are written using the M language.
For example:
Table.TransformColumnTypes(
    Sales,
    {{"Amount", type number}}
)
You normally do not need to write M manually for basic transformations because Power Query generates the code for you.
However, understanding M becomes useful when you need advanced transformations.
Common M Functions
Table.SelectRows()
Table.RemoveRows()
Table.RemoveColumns()
Table.Distinct()
Table.AddColumn()
Table.TransformColumnTypes()
Table.ReplaceValue()
Table.Combine()
You can inspect the generated M code through:
View → Advanced Editor
9. Mini Tutorial: Clean Bank Transaction Data
Imagine you receive this transaction file:
| Date | Customer | Branch | Amount |
|---|---|---|---|
| 2026-01-01 | ABC Ltd | Kathmandu | 10000 |
| 2026-01-01 | ABC Ltd | Kathmandu | 10000 |
| 2026-01-02 | XYZ Ltd | Pokhara | 5000 |
| 2026-01-03 | PQR Ltd | Kathmandu | null |
The data contains:
- Duplicate transactions
- A missing amount
- Potential data-type problems
Step 1 — Load Data
Go to:
Home → Get Data → Excel/CSV
Select the transaction file and choose:
Transform Data
Step 2 — Check Data Types
Make sure:
Date   → Date
Amount → Decimal Number
Branch → Text
Step 3 — Remove Duplicates
Select the columns that uniquely identify a transaction.
Then:
Home → Remove Rows → Remove Duplicates
Step 4 — Handle Missing Values
For the Amount column, decide what the business rule should be.
For example, if a blank amount should represent zero:
Transform → Replace Values
Replace:
null → 0
Do not automatically replace nulls with zero unless that is appropriate for the business meaning.
Step 5 — Clean Text
Branch names may contain unwanted spaces:
" Kathmandu "
"Pokhara "
Use:
Transform → Format → Trim
This produces:
Kathmandu
Pokhara
Step 6 — Close & Load
When the data is ready:
Home → Close & Apply
Power BI loads the transformed data into the model.
10. Power Query vs DAX
Understanding when to use Power Query and DAX is essential.
| Power Query | DAX |
|---|---|
| Data preparation | Data analysis |
| ETL | Business calculations |
| M language | DAX language |
| Runs during data refresh | Evaluates within the model |
| Clean data | Create measures |
| Transform data | Calculate KPIs |
Example
Remove duplicate customers:
Power Query
Calculate total deposits:
DAX
Total Deposits =
SUM(Deposits[Amount])
Calculate year-to-date deposits:
DAX
YTD Deposits =
TOTALYTD(
    [Total Deposits],
    'Date'[Date]
)
11. Real-World Bank Data Practice
Try this workflow with a transaction dataset:
Load Transaction Data
        ↓
Check Data Types
        ↓
Remove Duplicates
        ↓
Handle Null Values
        ↓
Trim Text
        ↓
Standardize Branch Names
        ↓
Split Transaction Reference
        ↓
Merge Branch Information
        ↓
Append Monthly Files
        ↓
Create Required Columns
        ↓
Close & Apply
After cleaning, the data should be ready for modeling and dashboard development.
12. Important Power Query Best Practices
1. Keep transformations organized
Use meaningful query names such as:
FactTransaction
DimBranch
DimCustomer
DimProduct
2. Remove unnecessary columns early
Don’t carry unused data throughout the transformation process.
3. Set correct data types
Incorrect data types can cause calculation and modeling problems.
4. Check Applied Steps
Make sure every transformation is necessary.
5. Prefer simple transformations
A clean and understandable query is easier to maintain.
6. Use query folding when possible
When working with supported data sources such as SQL Server, try to perform transformations that can be pushed back to the source database.
This can significantly improve performance.
13. Day 2 Quick Revision
Remember these five rules:
Power Query = Data Preparation
Applied Steps = Transformation History
Merge = JOIN
Append = UNION
Power Query = M | Data Model Calculations = DAX
14. Day 2 Challenge
Take any Excel or CSV transaction dataset and perform these tasks:
- Connect to the data using Power Query.
- Remove duplicate records.
- Change the date column to Date.
- Change the amount column to Decimal Number.
- Replace inappropriate blank values according to the business rule.
- Trim text columns.
- Split one column.
- Create a custom column.
- Practice Merge with a Branch table.
- Practice Append with two monthly transaction tables.
- Review all Applied Steps.
- Load the cleaned data into Power BI.
Expected Result
By the end of Day 2, you should be able to take raw data → clean data → transformed data → Power BI model confidently.
What’s Next?
Day 3: Data Cleaning & Transformation
In Day 3, we will go deeper into practical transformations such as Replace Values, Split Columns, Conditional Columns, Custom Columns, Fill Down/Up, Pivot/Unpivot, Group By, handling errors and nulls, and preparing messy real-world data for Power BI.
Learn • Practice • Build • Grow