Welcome to Day 1 of Power BI Learning! In this tutorial, you’ll learn the basic Power BI workflow, key components, data loading options, calculations, data modeling, relationships, and filter context.
1. The Power BI Workflow
The easiest way to understand Power BI is:
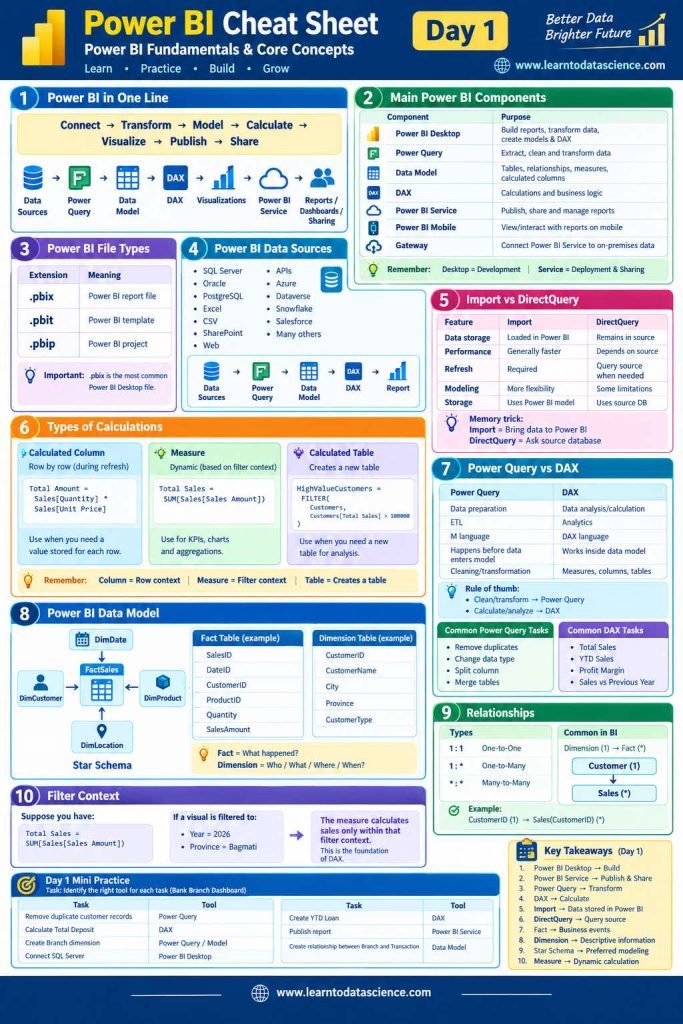
Connect → Transform → Model → Calculate → Visualize → Publish → Share
A typical Power BI project looks like this:
Data Source → Power Query → Data Model → DAX → Visuals → Power BI Service → Reports/Dashboards
Example
Suppose your company stores sales data in Excel.
- Connect to the Excel file.
- Use Power Query to clean the data.
- Create a Data Model with relationships.
- Use DAX to create calculations.
- Build charts and dashboards.
- Publish the report to Power BI Service.
- Share it with users.
2. Main Power BI Components
| Component | Purpose |
|---|---|
| Power BI Desktop | Build reports, transform data, create models and DAX |
| Power Query | Extract, clean and transform data |
| Data Model | Stores tables and relationships |
| DAX | Creates calculations and business logic |
| Power BI Service | Publish, share and manage reports |
| Power BI Mobile | View and interact with reports on mobile |
| Gateway | Connects Power BI Service to on-premises data |
Remember
Desktop = Development
Service = Deployment & Sharing
3. Power BI File Types
Power BI commonly uses these file formats:
.pbix→ Power BI report file.pbit→ Power BI template.pbip→ Power BI project
For beginners, .pbix is the most important file type because it is the standard Power BI Desktop report file.
4. Power BI Data Sources
Power BI can connect to many different sources, including:
- SQL Server
- Oracle
- PostgreSQL
- Excel
- CSV
- SharePoint
- Web
- APIs
- Azure
- Dataverse
- Snowflake
- Salesforce
The general process is:
Data Source → Power Query → Data Model → DAX → Report
5. Import vs DirectQuery
When connecting to a database, two important options are Import and DirectQuery.
| Feature | Import | DirectQuery |
|---|---|---|
| Data storage | Loaded into Power BI | Remains in source |
| Performance | Generally faster | Depends on source |
| Refresh | Required | Queries source when needed |
| Modeling | More flexible | Some limitations |
| Storage | Power BI model | Source database |
Easy way to remember
Import = Bring data to Power BI
DirectQuery = Ask the source database for data
For many beginner projects, Import mode is a good starting point.
6. Types of Calculations
Power BI provides different ways to create calculations.
Calculated Column
A calculated column calculates a value for each row.
Example:
Total Amount =
Sales[Quantity] * Sales[Unit Price]
Use a calculated column when you need a value stored for every row.
Column → Row Context
Measure
A measure calculates dynamically based on the current filter context.
Total Sales =
SUM(Sales[Sales Amount])
Measures are commonly used for:
- KPIs
- Charts
- Cards
- Aggregations
Measure → Filter Context
Calculated Table
A calculated table creates a new table using DAX.
For example:
HighValueCustomers =
FILTER(
    Customers,
    Customers[Total Sales] > 100000
)
Use calculated tables when you need a new table for analysis.
Remember
Column = Row context
Measure = Filter context
Table = Creates a table
7. Power Query vs DAX
One of the most important beginner concepts is knowing when to use Power Query and when to use DAX.
| Power Query | DAX |
|---|---|
| Data preparation | Data analysis |
| ETL | Analytics |
| Uses M language | Uses DAX language |
| Works before/while data enters model | Works inside data model |
| Cleaning & transformation | Measures, columns and tables |
Rule of thumb
Clean and transform → Power Query
Calculate and analyze → DAX
Example
Remove duplicate customers → Power Query
Calculate Total Sales → DAX
8. Build a Power BI Data Model
A good data model is essential for creating reliable reports.
A common design is a Star Schema.
It contains:
Fact Table
Contains business events or transactions.
Example:
FactSales
- SalesID
- DateID
- CustomerID
- ProductID
- Quantity
- SalesAmount
Dimension Tables
Describe the business events.
DimCustomer
- CustomerID
- CustomerName
- City
- Province
- CustomerType
Other examples:
- DimDate
- DimProduct
- DimLocation
Easy way to remember
Fact = What happened?
Dimension = Who / What / Where / When?
A typical model looks like:
DimCustomer → FactSales ← DimProduct
with DimDate → FactSales as well.
9. Relationships
Relationships connect tables in your data model.
Common relationship types are:
- 1:1 → One-to-One
- 1:* → One-to-Many
- *:* → Many-to-Many
The most common relationship in Power BI is:
Dimension (1) → Fact (*)
For example:
Customer (1) → Sales (*)
One customer can have many sales transactions.
Example:
Customer
CustomerID (1)
       ↓
Sales
CustomerID (*)
10. Filter Context
Filter context is one of the most important concepts in DAX.
Consider this measure:
Total Sales =
SUM(Sales[Sales Amount])
If a report visual is filtered to:
- Year = 2026
- Province = Bagmati
the measure calculates sales only within those filters.
So the same measure can return different results depending on the filters applied to the visual.
Think of it this way:
Filters → Filter Context → Measure Result
This is the foundation of dynamic calculations in Power BI.
11. Common Power Query Tasks
You’ll frequently use Power Query to:
- Remove duplicates
- Change data types
- Split columns
- Merge tables
- Clean data
- Transform columns
For example, if a customer table contains duplicate customer records, remove those duplicates in Power Query before building your model.
12. Common DAX Tasks
Some common beginner calculations include:
Total Sales
Total Sales =
SUM(Sales[Sales Amount])
YTD Sales
Used to calculate sales from the beginning of the year to the current period.
Profit Margin
Used to calculate profitability as a percentage.
Sales vs Previous Year
Used to compare current sales with the previous year’s sales.
These calculations are generally created as measures.
13. Mini Practice Project
Let’s put everything together.
Imagine you are building a Bank Branch Dashboard.
Step 1 — Connect
Connect Power BI to your sales/transaction data.
Step 2 — Transform
Use Power Query to:
- Remove duplicates
- Fix data types
- Rename columns
- Clean the data
Step 3 — Model
Create a star schema:
             DimDate
                ↓
DimCustomer → FactTransactions ← DimBranch
                ↑
            DimProduct
Step 4 — Calculate
Create measures such as:
Total Sales =
SUM(Sales[Sales Amount])
Step 5 — Visualize
Create:
- KPI cards
- Sales by branch
- Sales by month
- Sales by customer
- Sales trends
Step 6 — Publish
Publish your report to Power BI Service and share it with your intended audience.
Day 1 Cheat Code
If you remember only these 10 points, you have the foundation of Power BI:
- Power BI Desktop → Build
- Power BI Service → Publish & Share
- Power Query → Transform
- DAX → Calculate
- Import → Data stored in Power BI
- DirectQuery → Data remains in the source
- Fact → Business events
- Dimension → Descriptive information
- Star Schema → Preferred modeling approach
- Measure → Dynamic calculation
🎯 Day 1 Practice Challenge
Try completing these tasks in Power BI:
| Task | Tool |
|---|---|
| Remove duplicate customer records | Power Query |
| Calculate Total Deposit | DAX |
| Create Branch dimension | Power Query / Model |
| Connect to SQL Server | Power BI Desktop |
| Create YTD Loan | DAX |
| Publish report | Power BI Service |
| Create Branch–Transaction relationship | Data Model |
Final takeaway
A strong Power BI workflow is:
Connect → Transform → Model → Calculate → Visualize → Publish → Share
Once you understand this flow, you’re ready to move from simply loading data into Power BI to building proper analytical reports.