Article

Explore the intersection of data science and business intelligence with insightful articles on LearnToDataScience. Learn how leveraging data analytics empowers informed decision-making and drives business success.

Next generation of AI with Copilot in Power BI
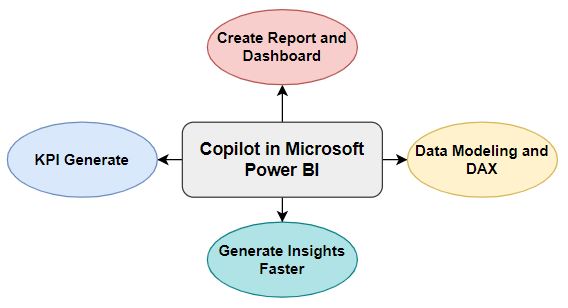
Power BI is a most popular and powerful data analysis and visualization platform that allows you to connect to different data sources, transform and model the data, create interactive reports and dashboards, and share your insights with others. It also supports custom visuals and extensions that can enhance your data experience. Copilot is the new

Next generation of AI with Copilot in Power BI Read More »

Microsoft Power BI new update-April2023

power bi

Introduction Microsoft Power BI is a most popular and widely used business intelligence tool that empowers users to visualize and analyze data efficiently. With its intuitive interface and powerful features, Power BI offers several advantages. One key feature is its ability to connect to diverse data sources, including databases and cloud services. This allows users

Microsoft Power BI new update-April2023 Read More »

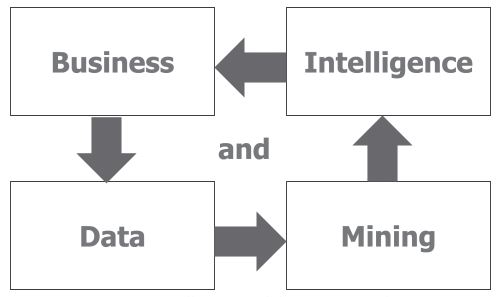
Modernizing Business Decision Making with the Power of Business Intelligence and Data Mining

In today’s data-driven world, businesses are faced with an overwhelming amount of information. Extracting actionable insights from this data is crucial for making informed decisions. This is where Business Intelligence (BI) and Data Mining come into play. In this article, we will explore the importance of BI and Data Mining, the most commonly used tools,

Modernizing Business Decision Making with the Power of Business Intelligence and Data Mining Read More »

Data Analysis Expressions (DAX) in Power BI- part I

Power BI is a powerful business intelligence tool developed by Microsoft that allows you to connect to various data sources, transform and model your data, and create interactive visualizations and reports. It provides advanced data analysis and visualization capabilities to help you gain insights and make informed business decisions. https://learntodatascience.com/index.php/how-to-load-data-in-power-bi-desktop/tutorial/1614/Load Data in Power BI Desktop

Data Analysis Expressions (DAX) in Power BI- part I Read More »

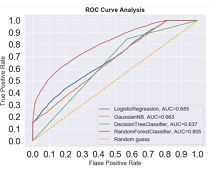
The ROC-AUC Curve: A Powerful Tool for Analyzing Binary Classification Model Performance

The ROC-AUC curve is created by plotting the true positive rate (TPR) against the false positive rate (FPR) at various classification thresholds. It provides a visualization of how well a binary classification model is able to distinguish between positive and negative examples. A model that performs better than random guessing will have an ROC curve

The ROC-AUC Curve: A Powerful Tool for Analyzing Binary Classification Model Performance Read More »

Scroll to Top