Power BI is often associated with dashboards, charts, and interactive reports.
However, a professional Power BI solution goes far beyond visualization.
As a Power BI Certified Data Analyst, I view Power BI as part of an end-to-end analytics workflow that connects data sources, transformation, semantic modeling, business logic, visualization, deployment, and decision-making.
The real value is not simply creating a dashboard. It is building a reliable path from raw data to trusted insights and actionable business decisions.
🔹 The End-to-End Power BI Analytics Workflow
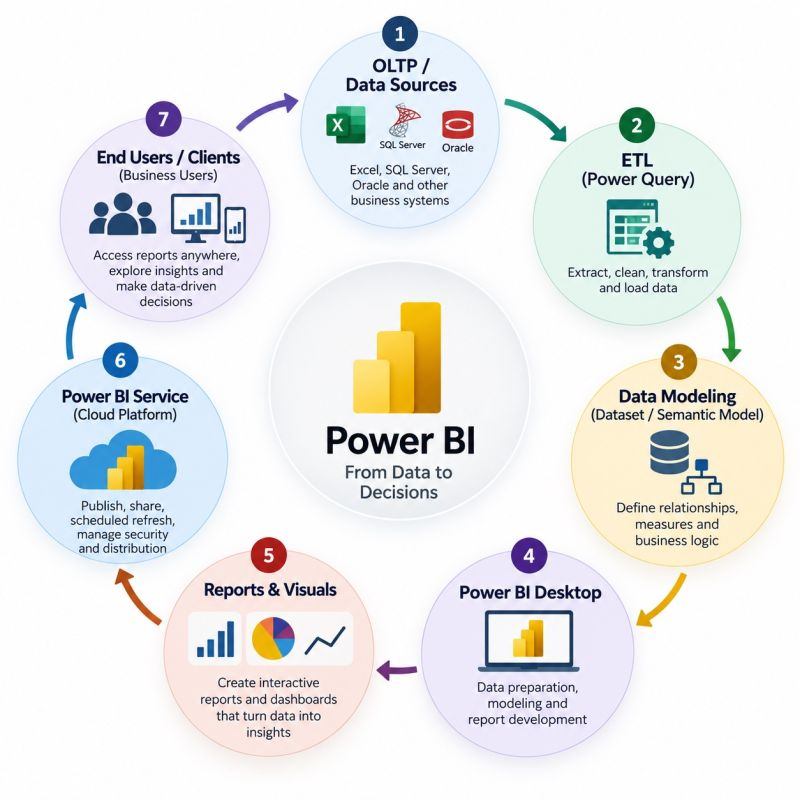
Data Sources → Data Transformation → Semantic Modeling → Report Development → Visualization → Power BI Service → Decision-Making
1️⃣ Data Sources — Where Business Data Begins
Every analytics solution starts with data.
Organizations generate data across multiple operational systems, including:
• Excel and CSV files
• SQL Server
• Oracle
• ERP and CRM systems
• APIs and cloud applications
• Data warehouses and other business systems
These systems are primarily designed to support business operations and transactions.
The first responsibility of a data analyst is therefore to understand the source, structure, quality, and business meaning of the data before building analytical solutions.
2️⃣ Data Transformation — Power Query
Raw data is rarely ready for analysis.
Using Power Query, analysts can:
• Extract data from multiple sources
• Clean and standardize datasets
• Handle missing and inconsistent values
• Transform data types
• Merge and append tables
• Remove unnecessary data
• Create repeatable transformation steps
The objective is not simply to make the data look clean.
The objective is to create consistent, reliable, and analysis-ready data.
3️⃣ Semantic Modeling — The Foundation of Reliable Analytics
Once the data has been prepared, the next critical step is building a robust semantic model.
This involves:
• Defining relationships between tables
• Designing fact and dimension tables
• Establishing appropriate granularity
• Creating measures
• Implementing business logic
• Defining consistent KPI calculations
A well-designed model—often using a star schema—provides the foundation for scalable and trustworthy analytics.
For example, instead of calculating revenue independently in multiple visuals, business logic can be centralized through reusable DAX measures.
This improves consistency, maintainability, reusability, and trust in the numbers.
4️⃣ Power BI Desktop — Development & Analysis
Power BI Desktop brings data preparation, modeling, DAX, and report development together.
This is where analysts develop:
• Data models
• DAX measures
• Business calculations
• Report pages
• Filters and slicers
• Interactive analytical experiences
The objective should not be to create as many visuals as possible.
The objective should be to answer meaningful business questions:
What happened?
Why did it happen?
Where is the issue?
What is driving the change?
What action should the business consider?
5️⃣ Reports & Visualizations — Turning Data Into Insight
Visualization is the most visible part of Power BI, but it is only one component of the overall analytical solution.
An effective report should focus on:
• Business objectives
• Relevant KPIs
• Clear visual hierarchy
• Appropriate visual selection
• User experience
• Performance and usability
A professional report should not simply display information.
It should help users quickly understand what matters, what changed, and where attention is required.
The right question is not:
“What chart should I create?”
The better question is:
“What decision will this visual help the user make?”
6️⃣ Power BI Service — Deployment, Sharing & Governance
After development and validation, the solution can be published to the Power BI Service.
This enables organizations to:
• Publish and distribute reports
• Schedule data refreshes
• Manage workspaces and apps
• Control access and permissions
• Implement Row-Level Security
• Collaborate across teams
• Govern and manage analytical content
This stage is important because a report has limited business value if users cannot securely and reliably access the information they need.
A mature Power BI solution therefore extends beyond development into deployment, security, governance, and lifecycle management.
7️⃣ End Users — Where Business Value Is Created
Ultimately, Business Intelligence is not about the report itself.
It is about what users can understand and do with the information.
Executives may monitor strategic KPIs.
Finance teams may analyze profitability and budgets.
Sales teams may identify performance trends and opportunities.
Operations teams may detect inefficiencies and process issues.
Management can use these insights to determine where action is required.
This is where analytics becomes business value:
Data → Insight → Action → Better Decisions
🔹 Power BI Is More Than Visualization
A chart can tell you that sales decreased by 12%.
A well-designed analytical solution can help answer:
• Which region contributed most to the decline?
• Which products were affected?
• Which customers changed their purchasing behavior?
• Is the decline seasonal?
• How does current performance compare with previous periods?
• What factors may be driving the change?
• Where should management focus its attention?
That difference is where the real value of Business Intelligence emerges.
Visualization presents information.
Analytics creates understanding.
Business Intelligence supports action.
🔹 The Role of a Power BI Data Analyst
A Power BI Data Analyst is not simply someone who creates dashboards.
The role requires a combination of:
Data Understanding + Data Transformation + Data Modeling + DAX + Visualization + Business Analysis + Communication
A strong analyst needs to understand both the technical and business perspectives.
From a technical perspective:
• Is the data accurate?
• Is the model properly designed?
• Are relationships correct?
• Are DAX measures producing the intended results?
• Is the report performant?
• Is the solution secure and maintainable?
From a business perspective:
• What business problem are we solving?
• Which KPIs actually matter?
• What decisions need to be supported?
• Who will use the report?
• What action should the insight enable?
The strongest Power BI solutions connect these two perspectives.
🔹 The Bigger Picture
Instead of thinking:
“Power BI is a tool for creating dashboards.”
Think:
“Power BI is an analytics platform that helps transform trusted data into business insight.”
The dashboard is simply the interface through which users experience the analytical solution.
Behind that interface are:
Data Sources
↓
Data Transformation
↓
Semantic Modeling
↓
Business Logic & DAX
↓
Reports & Visualizations
↓
Power BI Service
↓
Business Decisions
That is what makes Power BI valuable in a modern data-driven organization.
🔹 Final Thought
The real strength of Power BI is not its ability to create attractive charts.
It is its ability to establish a reliable analytical path from operational data to business action.
When data is properly prepared, modeled, analyzed, visualized, governed, and delivered to the right users, Power BI becomes much more than a reporting tool.
It becomes a bridge between data and decision-making.
Raw Data → Trusted Data → Insight → Action → Better Decisions
That is the real purpose of Business Intelligence.
Power BI Cheat sheet
Power BI Day 2: Power Query Fundamentals
Power BI Day 1: Fundamentals and Core Concepts
Download Power BI Desktop
Download Microsoft Power BI Desktop from Official Microsoft Page