Tutorial

Data science, power BI and python tutorial. Learn power bi and SQL for business intelligence and data science.  .

Creating Dynamic Titles in Power BI Visuals Based on Slicer Selections

Power bi Visuals dynamic title

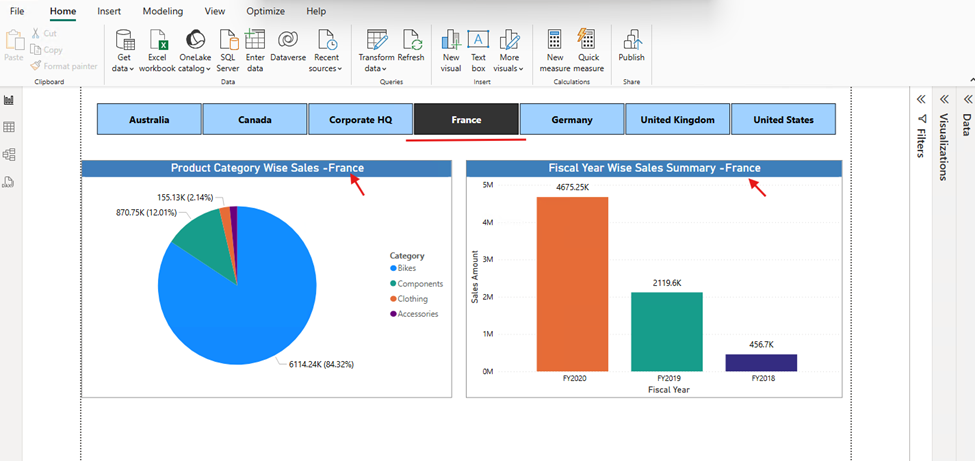
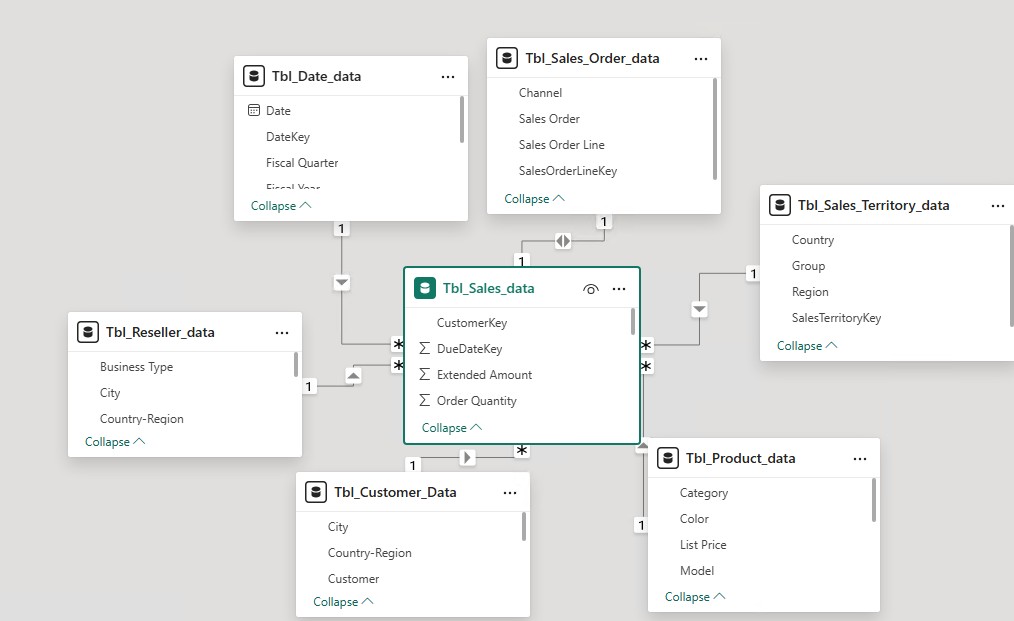
In this tutorial, we will learn how to create dynamic titles in Power BI that change based on user selections from a slicer. By using DAX measures, we can customize titles for visuals to reflect specific data Prepare Your Data Model Ensure your data model includes the necessary fields for the slicer filter, such as […]

Creating Dynamic Titles in Power BI Visuals Based on Slicer Selections Read More »

5 Ways to Optimize Power BI Dashboard Performance

power bi star schema model

Power BI dashboards can sometimes face performance challenges due to data model complexity and loading inefficiencies. Understanding key optimization techniques helps ensure smooth and efficient report interaction. This guide outlines practical steps to enhance dashboard performance Disable Auto Date/Time in Data Load By default, Power BI automatically creates hidden date tables for date fields. This

5 Ways to Optimize Power BI Dashboard Performance Read More »

Power BI DAX Functions

Power BI DAX

DAX (Data Analysis Expressions) is a formula language used in Power BI, Power Pivot, and Analysis Services. It consists of functions, operators, and constants that enable users to create custom calculations in calculated columns and measures. DAX allows users to extract insights, perform complex calculations, and manipulate data within a data model. What is a

Power BI DAX Functions Read More »

How to Run Python Scripts in Power BI Desktop

run python scripts in power bi

Introduction How to Run Python Scripts in Power BI Desktop Power BI is a powerful data visualization tool, but sometimes, you need advanced analytics, automation, or custom data transformation. This is where Python scripting in Power BI comes in! With Python, you can:✅ Perform complex data transformations✅ Fetch external data (e.g., stock market, web scraping,

How to Run Python Scripts in Power BI Desktop Read More »

Mastering Data Visualization: A Concise Overview of Different Chart Types

Pareto Chart

Data visualization is a powerful tool for making sense of complex data. By using various chart types, we can highlight trends, compare quantities, and uncover patterns. Here’s a quick guide to some of the most commonly used visualization methods: Bar Chart Rectangular bars represent different categories, making it easy to compare quantities across multiple groups.

Mastering Data Visualization: A Concise Overview of Different Chart Types Read More »

Applying Conditional Formatting to a Line Chart in Power BI

line chart in power bi

Conditional formatting to a line chart in Power BI can enhance data visualization by highlighting trends and changes. While Power BI does not support direct conditional formatting for line charts, you can achieve similar effects using a workaround (creating a bar chart with conditional formatting and then changing it to a line chart) . This

Applying Conditional Formatting to a Line Chart in Power BI Read More »

Top SQL Interview Questions and Answers

Top SQL Interview Questions And Answers

Explore this curated list of Top SQL interview questions and answers to enhance your readiness for SQL-related job interviews. From fundamental concepts to advanced, these questions cover key topics like database, SQL structure and syntax, joins, subqueries,views, stored procedure and more. Use this resource to sharpen your SQL skills and excel in your next interview

Top SQL Interview Questions and Answers Read More »

Scroll to Top