Logistic regression is a data analysis technique that uses mathematics to find the relationships between two data factors.
Logistic Regression is a powerful tool used in statistics to predict the likelihood of something happening. It’s especially handy when there are only two possible outcomes, like whether a loan gets fully paid or not. Think of it like a calculator that looks at different factors (like income, credit score) and guesses the chance of an event occurring.
It works with supervised machine learning, which means it learns from examples where we already know the answers. By studying these examples, the model figures out how different factors relate to the outcome we’re interested in.
The cool thing is, logistic regression doesn’t just predict. It also helps us understand which factors are most important. We can use it to make better decisions, like whether to approve a loan or not.
So, logistic regression is like having a smart assistant that analyzes data, makes predictions, and helps us understand what really matters in making decisions. It’s a simple yet powerful tool that’s widely used across different fields to solve all sorts of problems.
sigmoid function
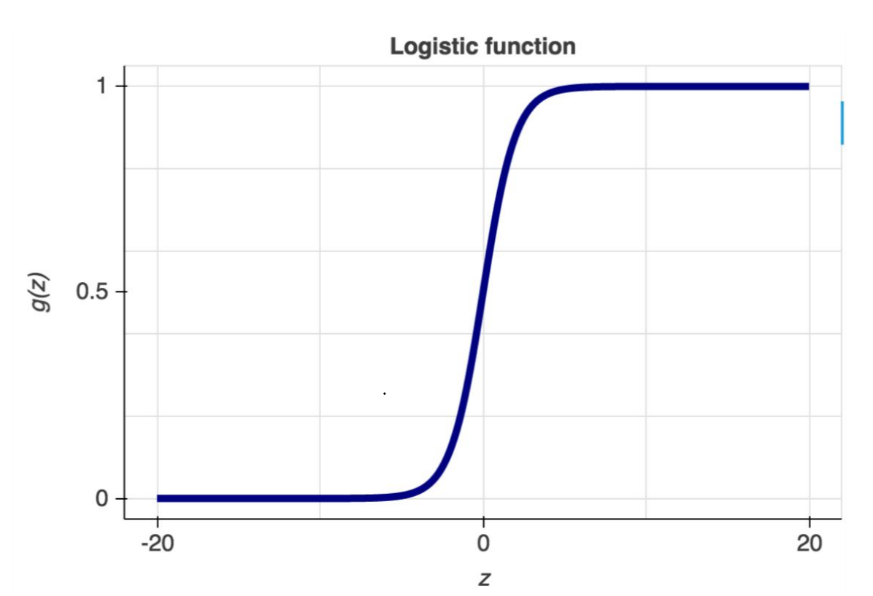
The sigmoid function, also known as the logistic function, is a fundamental component of logistic regression. It’s utilized to model the relationship between the independent variables and the probability of the binary outcome.
It requires the dependent variable to be binary, and the independent variables should be independent of each other and linearly related to the log odds.
Dependent Variable: It must be binary, meaning it can take only two possible values. This binary outcome is what logistic regression aims to predict.
Independence of Variables: Each independent variable should be independent of the others. This assumption is crucial because logistic regression assumes that the effects of each independent variable on the log odds of the dependent variable are additive.
Linear Relationship with Log Odds: The relationship between the independent variables and the log odds of the dependent variable should be linear. However, this linearity is in terms of the log odds, not the probabilities themselves. This assumption ensures that the logistic regression model is able to properly estimate the effects of the independent variables on the probability of the binary outcome.
Logistic Regression can be expressed as:
Logit = log(p(X)/1 − p(X))
where,
P(X)= probability of event happening
1-P(X)= probability of event not happening.
and p(x)/(1-p(x)) is called odds.
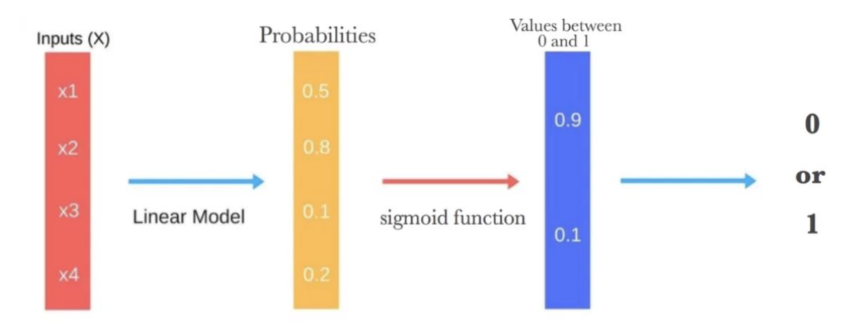
The sigmoid function yields an S-shaped curve capable of mapping any real-valued number to a value between 0 and 1. As the curve approaches positive infinity, the predicted value g(Z) tends toward 1, while at negative infinity, it tends toward 0. If the output of the sigmoid function exceeds 0.5, we classify the outcome as 1 or “YES”; conversely, if it falls below 0.5, we classify it as 0 or “NO.”
Logistic Regression Classification Model using python Skit-learn
# Import necessary libraries
import pandas as pd
from sklearn.model_selection import train_test_split
from sklearn.linear_model import LogisticRegression
from sklearn.metrics import accuracy_score

# Load sample loan dataset (you would replace this with your actual dataset)
loan_data = pd.read_csv("loan_dataset.csv")

# Assuming loan_status is the target variable and other columns are features
X = loan_data.drop(columns=["loan_status"])  # Features
y = loan_data["loan_status"]  # Target variable

# Split the data into training and testing sets
X_train, X_test, y_train, y_test = train_test_split(X, y, test_size=0.2, random_state=42)

# Create a logistic regression model
model = LogisticRegression()

# Train the model on the training data
model.fit(X_train, y_train)

# Predict loan status on the testing data
y_pred = model.predict(X_test)

# Evaluate the model's accuracy
accuracy = accuracy_score(y_test, y_pred)
print("Accuracy:", accuracy)
In this example:
- We assume we have a loan dataset stored in a CSV file named “loan_dataset.csv”.
- Load the dataset into a pandas DataFrame.
- Split the dataset into features (X) and the target variable (y).
- Split the data into training and testing sets.
- Create a logistic regression model using LogisticRegression() constructor.
- Train the model on the training data using fit method.
- Predict loan status on the testing data using predict method.
- evaluate the model’s accuracy using the accuracy_score function from scikit-learn.
Replace “loan_dataset.csv” with the actual filename/path of your loan dataset. Additionally, ensure your dataset is properly preprocessed and encoded before training the model.
Model Performance Evaluation
Confusion Matrix
A confusion matrix is a table that summarizes the performance of a classification model. It shows the counts of true positive (TP), true negative (TN), false positive (FP), and false negative (FN) predictions made by the model.
- True Positive (TP): The model correctly predicts positive cases.
- True Negative (TN): The model correctly predicts negative cases.
- False Positive (FP): Also known as Type I error, the model incorrectly predicts positive cases.
- False Negative (FN): Also known as Type II error, the model incorrectly predicts negative cases.

From the confusion matrix, various performance metrics can be derived, such as accuracy, precision, recall (sensitivity), specificity, and F1 score, which provide insights into the model’s performance.
Read more about confusion matrix: Confusion Matrix: Tool For Evaluating Machine Learning Models
ROC-AUC Curve
The Receiver Operating Characteristic (ROC) curve is a graphical representation of the true positive rate (sensitivity) against the false positive rate (1 – specificity) for different threshold values of a classification model. It illustrates the trade-off between sensitivity and specificity across various threshold levels.
The Area Under the ROC Curve (AUC) quantifies the overall performance of the classification model. A higher AUC value indicates better discrimination ability of the model, with an AUC of 0.5 representing a random classifier, and an AUC of 1 representing a perfect classifier.
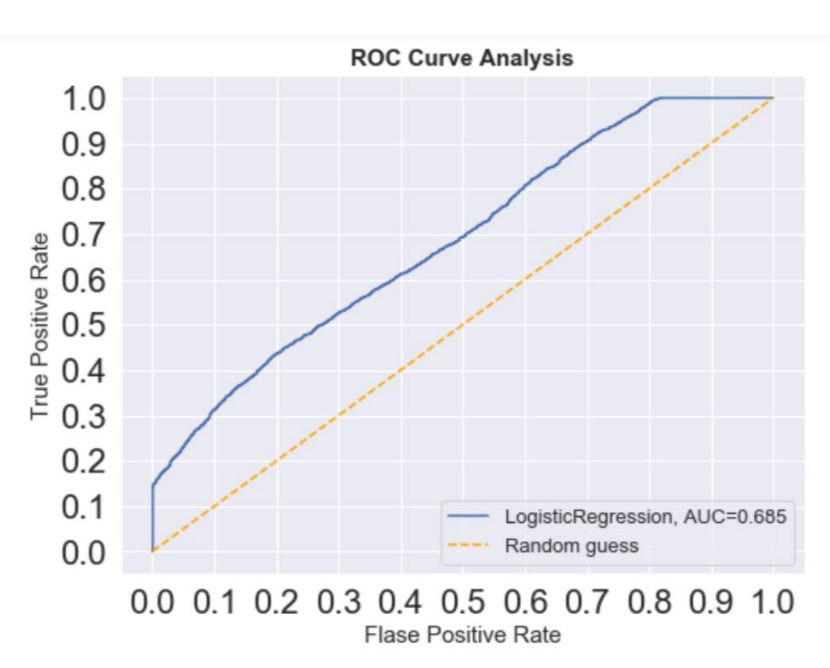
The ROC-AUC curve provides valuable insights into the model’s ability to distinguish between positive and negative classes across different threshold levels, making it a useful tool for evaluating the performance of logistic regression models, especially in binary classification tasks.
Read more about ROC-AOC Curve: The ROC-AUC Curve: A Powerful Tool For Analyzing Binary Classification Model Performance
Advantages and Disadvantages of Logistic Regression
Advantages
Interpretability: Logistic regression coefficients provide clear interpretation of the relationship between independent variables and the log odds of the outcome.
Efficiency: Logistic regression is computationally efficient and can handle large datasets with relatively low computational resources.
Probabilistic Output: Logistic regression outputs probabilities, allowing for nuanced decision-making based on class probabilities.
Less Susceptible to Overfitting: Logistic regression is less prone to overfitting when the number of features is small compared to the number of observations.
Disadvantages
Assumption of Linearity: Logistic regression assumes a linear relationship between independent variables and the log odds of the outcome, which may not always hold true.
Limited to Binary Outcome: Logistic regression is designed for binary classification and may require modification for multi-class problems.
Highly Sensitive to Outliers: Outliers can heavily influence logistic regression models, potentially leading to biased estimates.
Requires Independent Observations: Logistic regression assumes that observations are independent, which may not be the case in certain datasets, leading to biased results.