Introduction
Microsoft Power BI is a most popular and widely used business intelligence tool that empowers users to visualize and analyze data efficiently. With its intuitive interface and powerful features, Power BI offers several advantages.
One key feature is its ability to connect to diverse data sources, including databases and cloud services. This allows users to import and integrate data seamlessly, eliminating manual consolidation efforts.
Power BI provides a wide range of customizable visualizations such as charts, graphs, and maps. Users can easily create interactive dashboards and reports, enabling them to explore data and identify trends without coding skills.
Collaboration is facilitated through secure sharing of dashboards and reports, promoting real-time data sharing and informed decision-making across teams.
Data modeling capabilities in Power BI, including data cleansing and transformation, ensure accuracy and consistency in reporting. Users can shape and transform data using Query Editor and Data Modeling tools to meet their analysis requirements.
Integration with other Microsoft products and services, such as Excel, SharePoint, and Azure, enhances the value of existing data assets and streamlines workflows.
Microsoft Power BI is a comprehensive business intelligence tool with an intuitive interface, seamless data connectivity, customizable visualizations, collaborative features, robust data modeling capabilities, and integration with other Microsoft services.
Power BI June 2023 Update
Microsoft continuously updates Power BI features to enhance data connectivity, visualization options, artificial intelligence capabilities, and collaboration and sharing functionalities.
The following are the feature of power bi that Microsoft updated in June 2023.
In Reporting Section
New card visual (Preview)
OneLake data hub in Power BI Desktop
On-Object Interaction – Updates (Preview)
IN Data connectivity and preparation
Introducing Visual Cue for New Tenant Settings
Introducing the Tenant Admin Settings API
In Service Section
Storytelling in PowerPoint – Embed visuals from Power BI organizational apps
Edit your data model in the Power BI Service – Updates (Preview)
Introducing a new admin setting to control email subscriptions for B2B guest users
Admin Monitoring (Preview)
Power BI Guidance Documentation
In Embedded Section
Get started with Power BI embedded in minutes
Create Power BI reports instantly in Jupyter Notebooks
In Developers Section
Power BI Desktop Developer Mode (Preview)
In Visualizations Section
New visuals in AppSource
Create the most interactive waterfall charts
PowerGantt Chart by Nova Silva
Advanced Linear Gauge by MAQ Software (NEW)
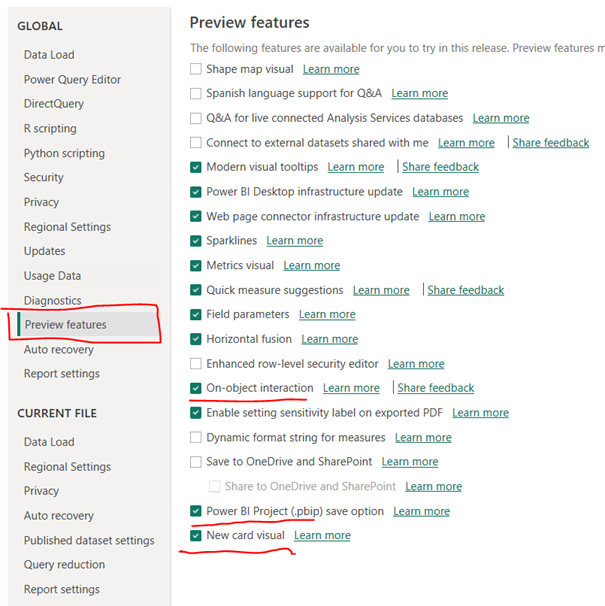
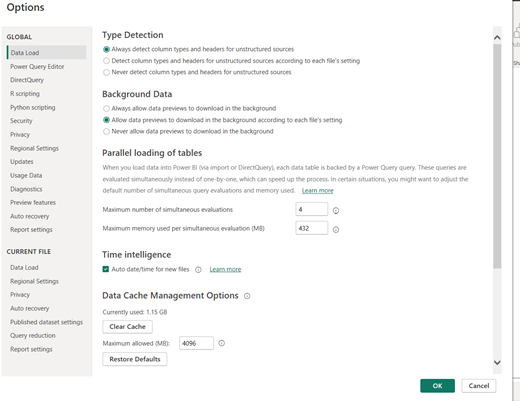
How to enable the Preview Features:
1. Go to the File > select Options and Setting
2. Select Options
3. Go the Preview features
In this post we will discuss about the updating reporting features of Microsoft Power BI.
1. New Card Visuals (Preview)
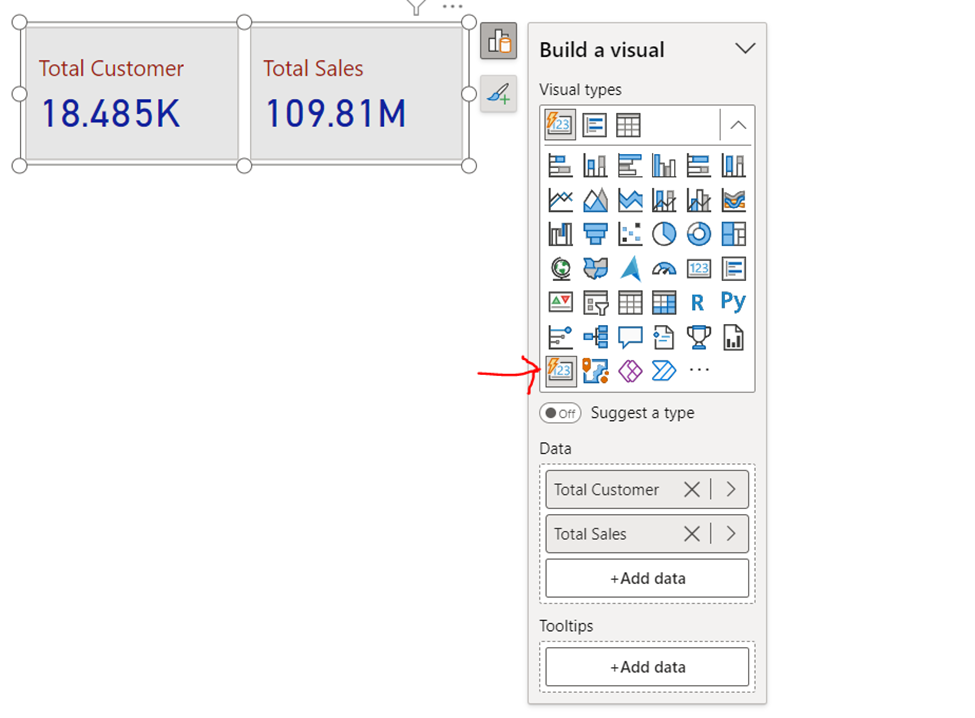
In existing card visuals only one field are allowed to add in data fields. In New card visuals we can display multiple cards by dragging and dropping all fields or measures into the Data field well. For now it is available in preview feature so that we need to enable it from Options > Preview features > New card visual.
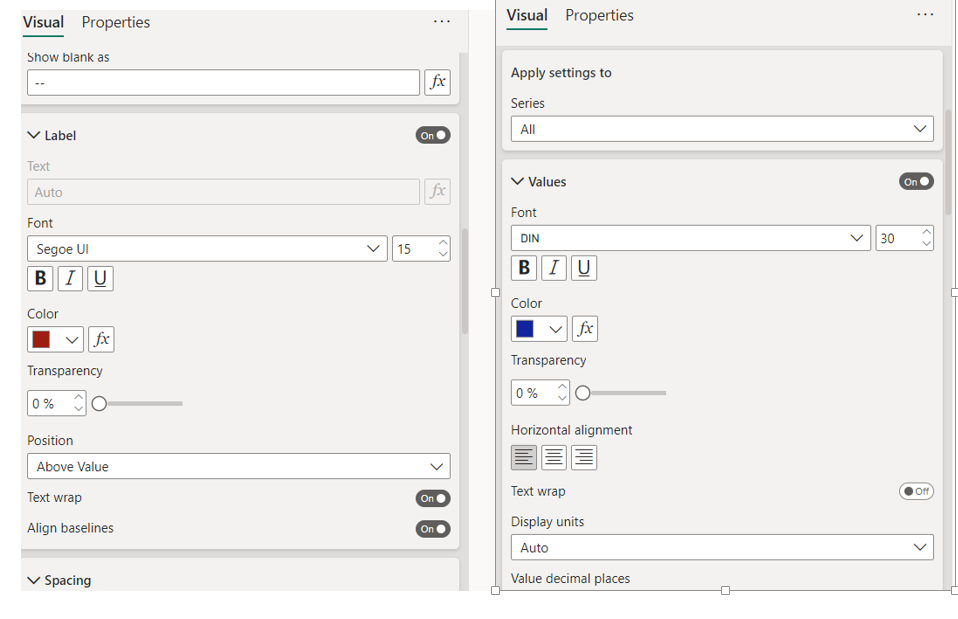
It Support customize card shape and new format setting for values and labels which helps to display cards more visually appealing.
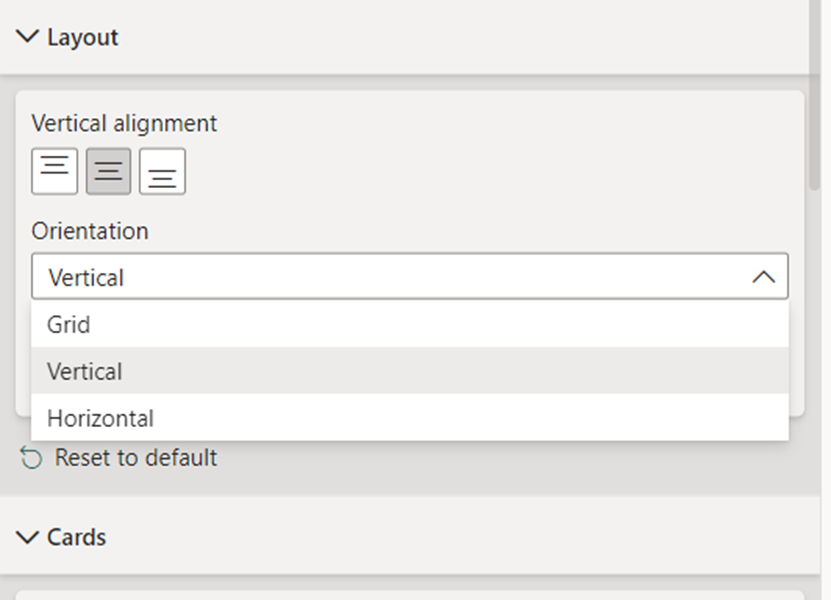
We can select three layouts (Horizontal, vertical, and grid) and optimize cards by adjusting the padding, spacing, and text alignment.
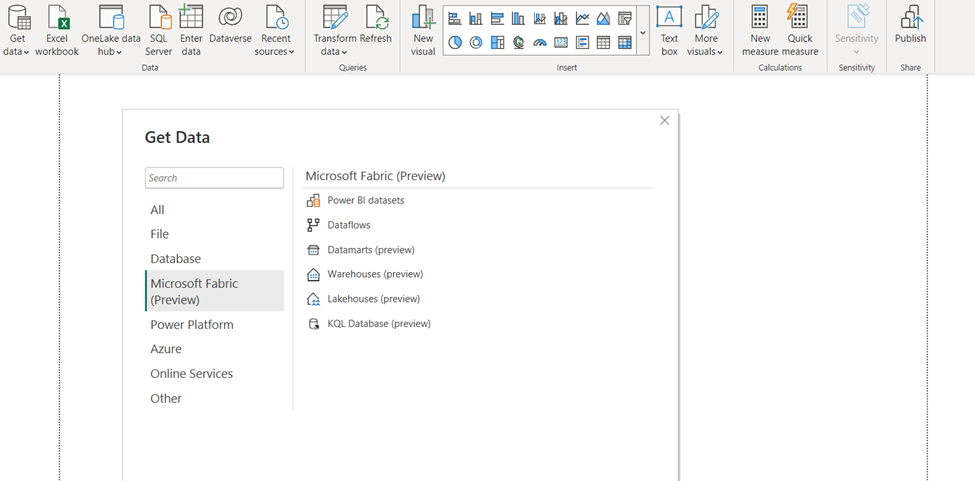
2. OneLake data hub in Power BI Desktop
With the recent Fabric release, Microsoft Power BI introduce the rebranded data hub in Power BI Desktop, now known as the “OneLake data hub.” The OneLake data hub in Microsoft Power BI serves as a centralized platform for discovering and reusing data, providing users with a seamless experience.
Within the OneLake data hub, Microsoft Power BI users can easily access and utilize a variety of data resources. These include data warehouses, lakehouses, their associated SQL endpoints, datamarts, and datasets (with KQL databases becoming available later this year).
When working with lakehouses, SQL endpoints, datamarts, and warehouses, Microsoft Power BI users have two options for obtaining data:
Connect to the underlying auto-generated dataset, leveraging the existing data structure for reporting and analysis needs.
Connect directly to the SQL endpoint to create a custom dataset tailored to specific requirements, giving more flexibility and control over the data.
The rebranded OneLake data hub in Microsoft Power BI empowers users with enhanced data management and discovery capabilities, enabling efficient data utilization and maximizing the potential of the Fabric ecosystem
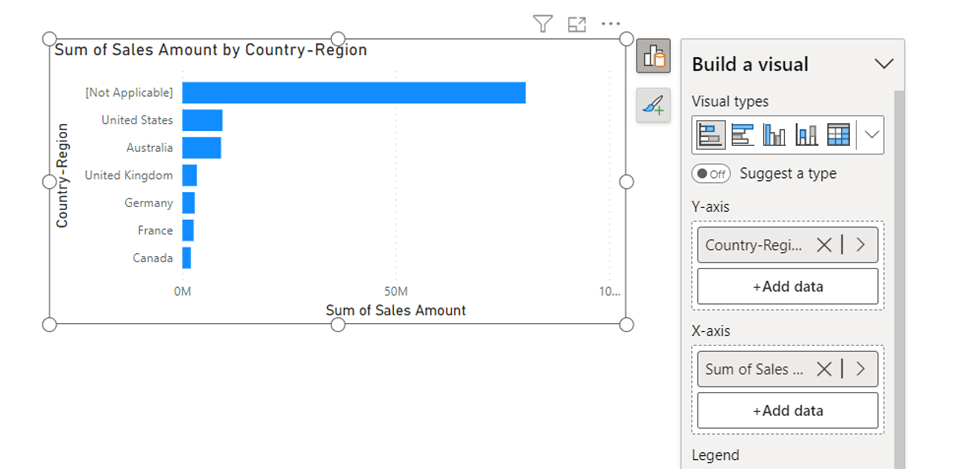
3. On-Object Interaction – Updates
Microsoft released the on-object interaction (preview) features in March. In June, Microsoft updates the some features in On-object Interactions.
Now users can attach the build menu to the pane switcher by 1 of 3 ways:
Directly from the on-object button:
From the View ribbon:

From the options menu:
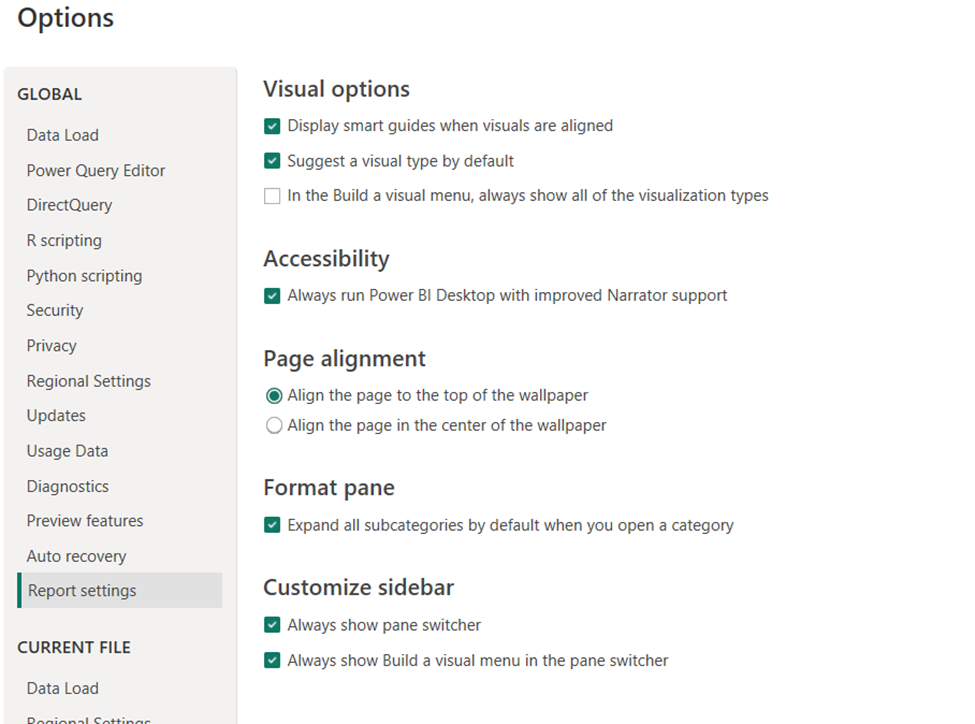
Microsoft introduced two new settings in Power BI. Firstly, users can now re-attach the build menu, giving them more flexibility in customizing their workspace. Secondly, users have the option to keep the pane switcher always visible, providing easier access to different panes within Power BI. These settings will be saved and applied consistently across multiple reports.
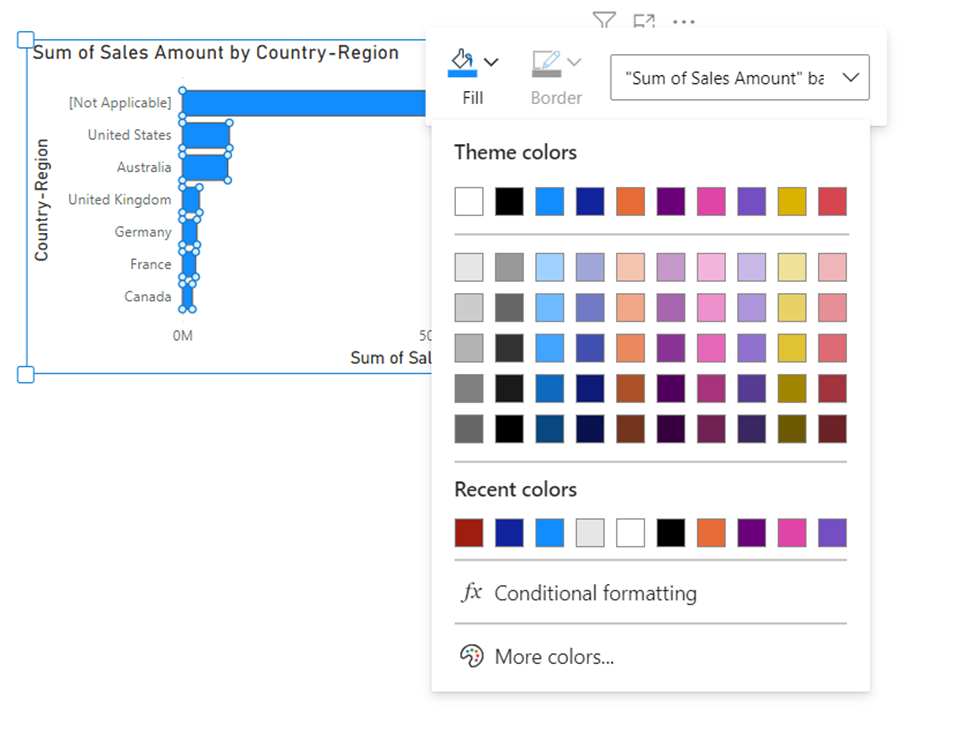
Another addition this June version is setting and editing conditional formatting from the on-object mini toolbars:
For more detailed information about the updated features, please visit the Microsoft Power BI Blog.
Microsoft Power BI Quick Start Guide