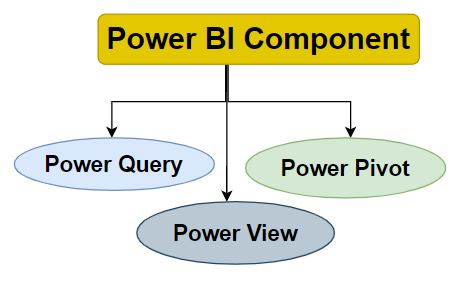
Microsoft Power BI is a business analysis tool used for data analysis and insights generation. It offers interactive dashboards to present data, facilitating quick decision-making.
In January 2024, Power BI released a Feature Summary for Power BI Report Server, introducing several enhancements:
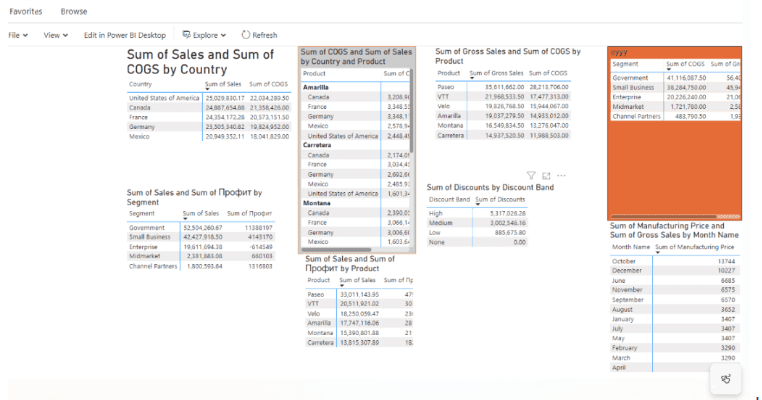
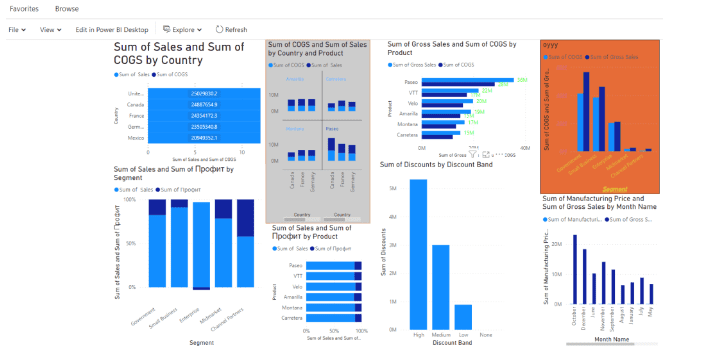
Show Visuals as Tables
Power BI now introduces a new view mode called ‘Show Visuals as Tables,’ allowing users to display report visuals in a tabular format with a single action. This feature accommodates different learning styles and technology usage preferences, enabling users to consume data in a text-based or tabular format. The underlying data for visuals on all pages in the current report will be displayed in ‘Show Visuals as Tables,’ offering added functionality with interaction and cross-filtering capabilities. To activate this view mode, users can go to the view dropdown menu and select the ‘Show Visuals as Tables’ feature.
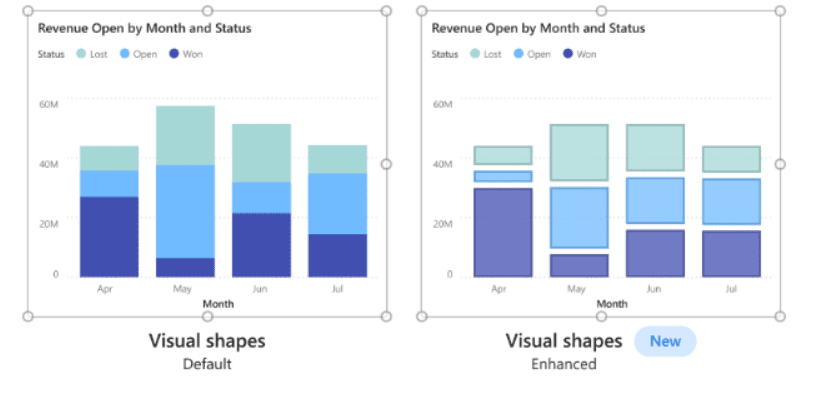
More Styling Options for Column and Bar Charts
They announce that many new formatting enhancements for column and bar charts in Power BI. These additions are designed to improve your data visualization, enabling more impactful analysis and storytelling capabilities
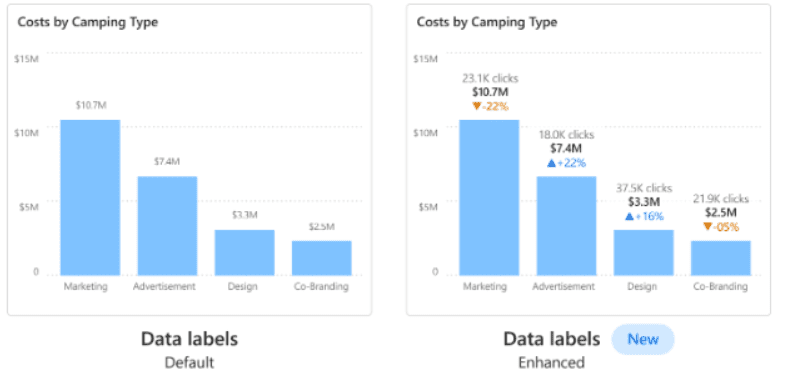
Extended Customization for Data Labels
Power BI now offers additional data label options in its latest update. This includes enhanced capabilities, providing extended customization choices to seamlessly match your reporting needs. The update also brings simple integration of additional metrics, significantly improving your data analysis experience
These enhancements contribute to a more versatile and user-friendly experience within Power BI, empowering users to tailor their analysis and reporting based on individual preferences and requirements.
Read more on Power BI Blog:
Power BI Report Server January 2024 Feature Summary