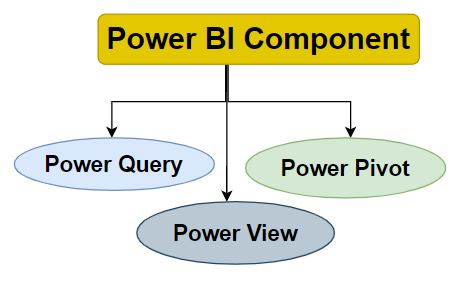
Power BI Desktop is the powerful business intelligence tool developed by Microsoft. It supports to connect multiple data sources, data modeling, data reshaping and transformation, interactive visualizations, and perform advanced data analytics.
Power BI desktop version is free, users can download and use the application for free. However, for the full-functional web-based services, user license is required.
In this article we will discuss the methods to load data in Power BI Desktop.
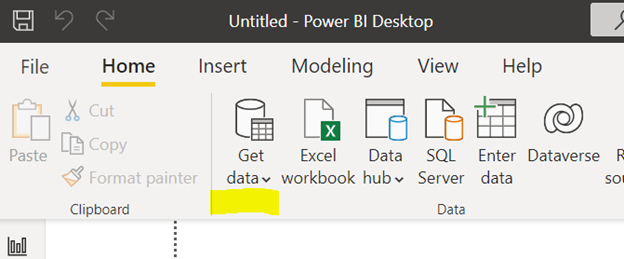
Step 1: Open Power BI desktop and select Get data option in the Home Tab.
Step 2: Get data menu shows multiple options as a source, select the best suited source.
For example: You may see the sources like Excel, csv, sql server, analysis Services, oracle, MySQL, PostgreSQL etc.
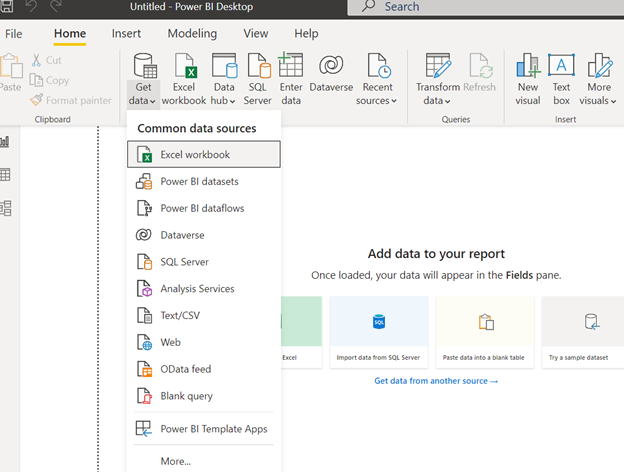
Note: You can always search for more options if the desired source is not in the Common data sources list.
Step 3: Choose your data source from the available list of data source.
There are multiple options available like file, Database, Azure, power platform and online and web services.
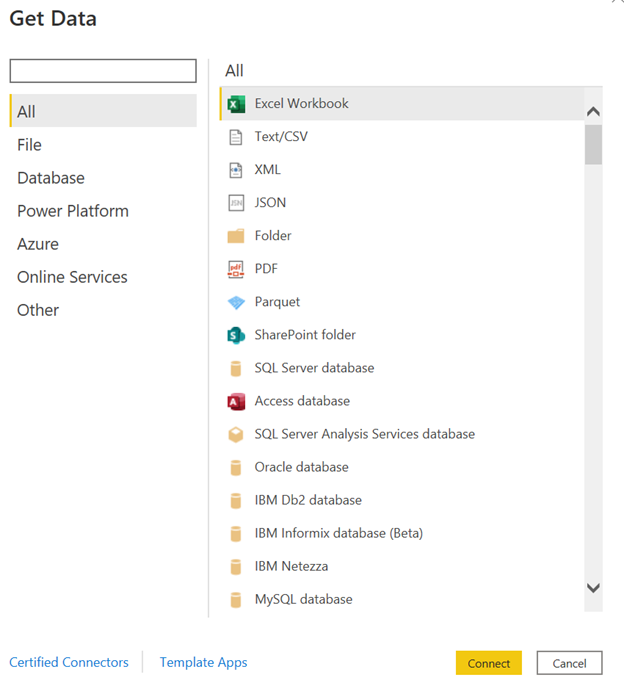
In this tutorial, we will load data from SQL Server Database. Following the same process, we can load the data from other sources as well.
Once we select the SQL Server Database as our data source, we need to provide the Database Server IP and Database name (optional).
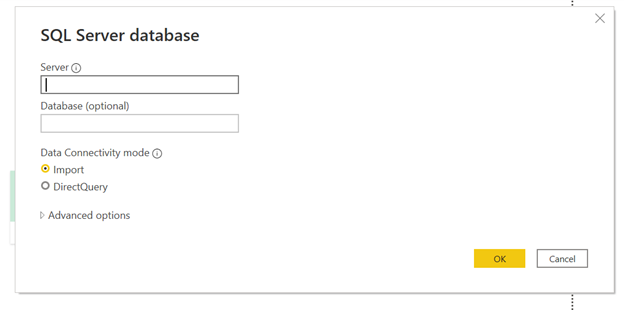
There are two data connectivity modes available in SQL Server connection viz. Import mode and Direct Query mode.
To learn more about the data connectivity options, you can follow the link below:
https://learntodatascience.com/data-connectivity-modes-in-power-bi-desktop/
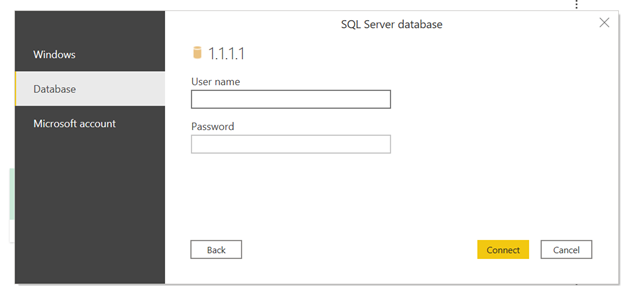
Step 4: Once the connectivity mode is selected, we move towards the access credentials of the database.
The Database Username and Password is provided to connect to the source Database.
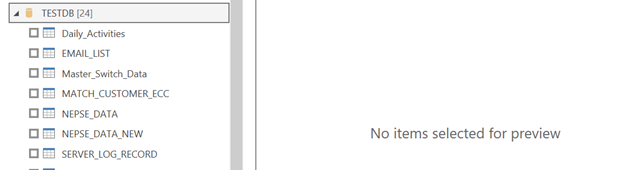
We can load the existing tables in the selected Database or write the custom SQL query by selecting advanced options.
Before loading the data, we can also perform the data preprocessing using Power Query. For instance, we can change the column type or create new custom columns before loading the data to visualize them.
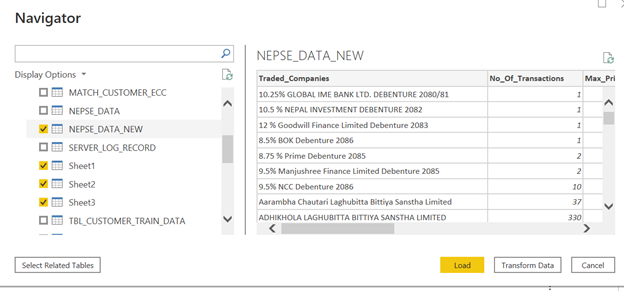
The selected table is then loaded to Power BI Desktop.
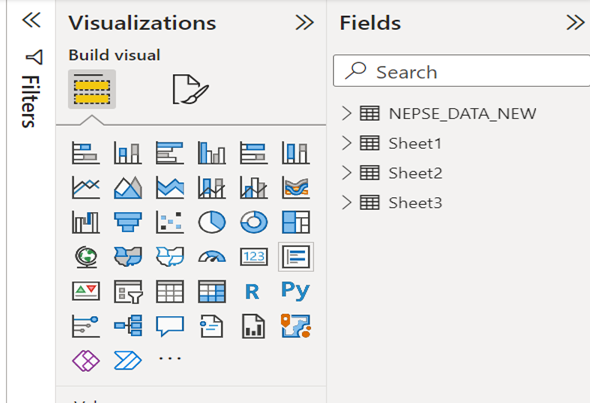
Step 5: After the data is loaded, we can move towards the dashboard development and visualization.
Power BI Desktop offers a wide range of data visualizations options that can be used to present the data in a meaningful and interactive way. Users can customize the visuals with colors, fonts, and other design elements to match their branding and style.
In addition, Power BI Desktop support a range of advanced analytics capabilities, such as data modeling, forecasting, and clustering. Users can also create custom calculations and business logic using the DAX (Data Analysis Expressions) language.