The ROC-AUC curve is created by plotting the true positive rate (TPR) against the false positive rate (FPR) at various classification thresholds. It provides a visualization of how well a binary classification model is able to distinguish between positive and negative examples.
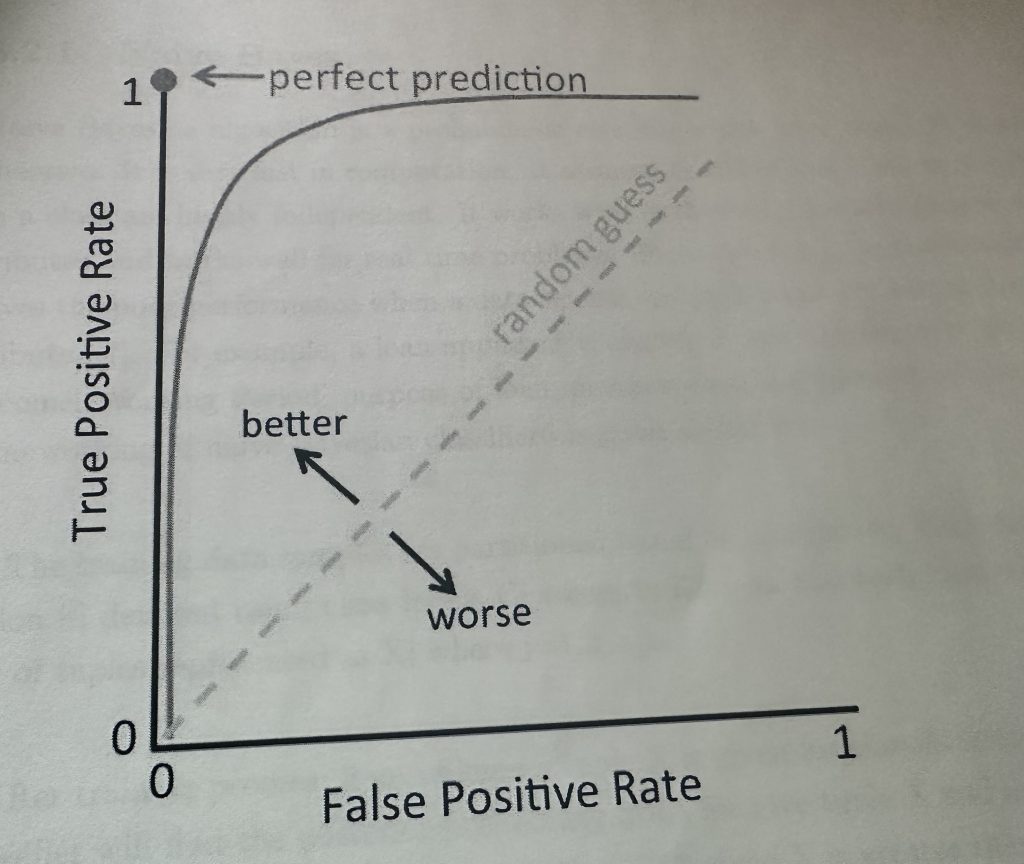
A model that performs better than random guessing will have an ROC curve that is above the diagonal line representing random guessing. The maximum difference between the model’s ROC curve and the diagonal line represents the maximum achievable performance of the model. Therefore, a model that has a larger area under its ROC curve (i.e., higher AUC value) is considered to be a better classifier than a model with a smaller AUC value, as it can distinguish between positive and negative examples with higher accuracy.
TP = True Positive
FN = False Negative
FP = False Positive
TN = True Negative
True Positive Rate = T P / T P + F N
False positive Rate = F P / F P + T N
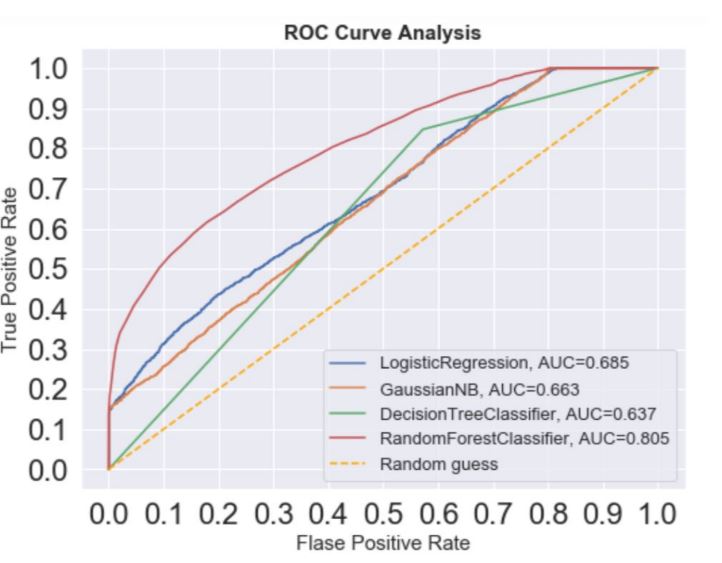
In above ROC-AUC curve, the random forest classifier has the highest AUC value of 0.805, indicating that it performs the best as compared to other models at distinguishing between positive and negative examples. The logistic regression model has an AUC of 0.685, followed by the Gaussian Naive Bayes model with an AUC of 0.663, and the decision tree classifier with an AUC of 0.637.
A higher ROC-AUC score generally indicates better model performance. Here are a few reasons why a high ROC-AUC score is considered desirable:
- Discrimination Ability: A high ROC-AUC score suggests that the model can effectively distinguish between the positive and negative classes. It reflects the model’s ability to correctly rank instances, with higher scores indicating better discrimination.
- Threshold Independence: ROC-AUC is not sensitive to the specific choice of the classification threshold. This is beneficial because it evaluates the model’s performance across various threshold values, providing a more comprehensive assessment.
- Balance between Sensitivity and Specificity: The ROC curve considers both sensitivity (true positive rate) and specificity (true negative rate). A high ROC-AUC indicates a good balance between these two metrics, which is crucial in many real-world applications.
- Robustness to Class Imbalance: ROC-AUC is less affected by class imbalance compared to some other metrics. In scenarios where one class is much more prevalent than the other, ROC-AUC provides a more reliable performance evaluation.