Microsoft Power BI introduced the on-object feature in Power BI Desktop (March 2023) for creating and customizing visuals directly on the object. This new feature provides new way to build and format your visuals directly on the visual. It makes the work of developer much easier and faster.
For Now, Power BI released this feature as “Preview features”. To enable the on-object feature in Power BI Desktop you need to follow the below steps.
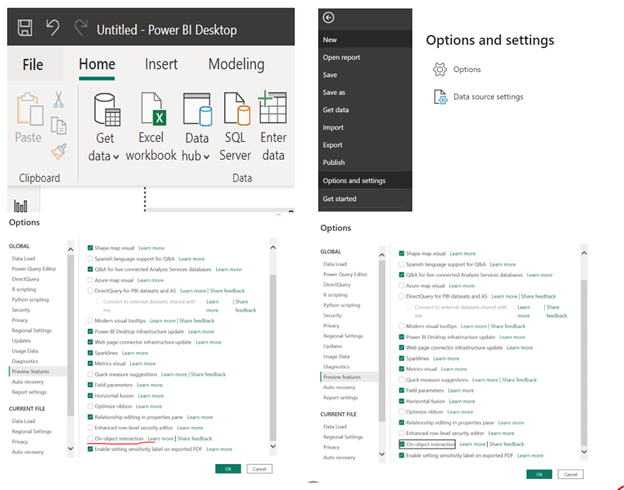
Go to File > Option and Settings > Options> Preview Features> On-object Interactions and then restart the Power BI Desktop.
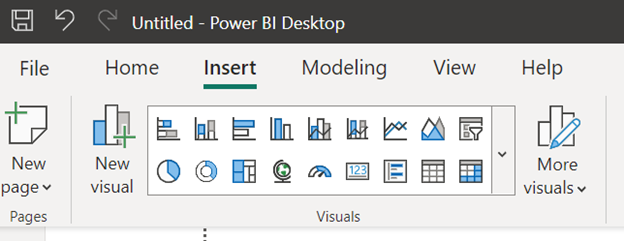
The visualization pane is no longer available in its previous location, but it can now be found under the insert tab.
Building a visual on-object
Step 1: Load data into Power BI Desktop.
You can refer to this link to learn how to do it:
https://learntodatascience.com/how-to-load-data-in-power-bi-desktop/
Step 2: There are two ways to add a visual to the canvas:
Navigate to the “Insert” tab and select the desired visual.
Right-click on the canvas and choose the “Add visual” option.

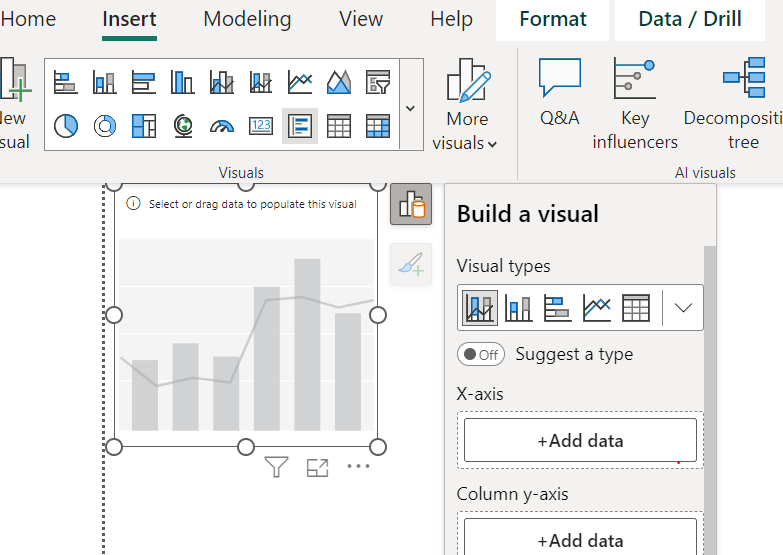
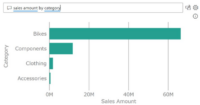
In the visual, you can view the various types of visuals available and the options to add data.
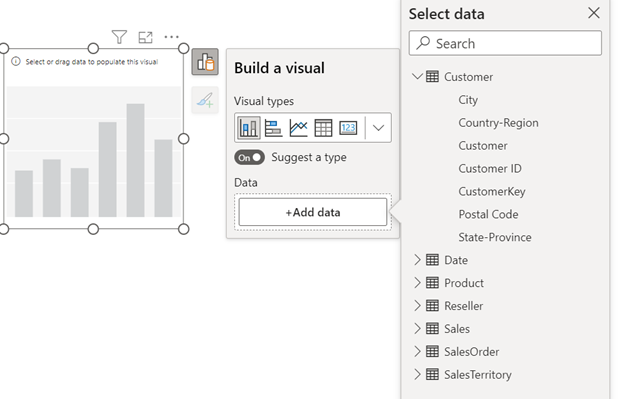
By clicking on “Add data,” you can choose the data and design the appropriate visualizations based on the selected data.
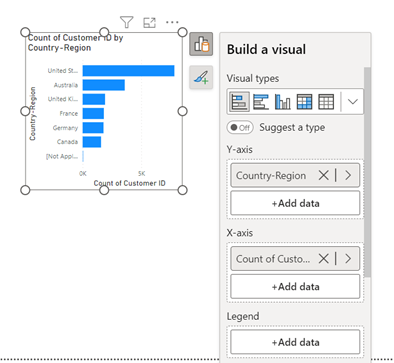
You can select both the data and visual type from the “Build a visual” options. Additionally, you can format the visuals by using the “Add to your visual” feature.
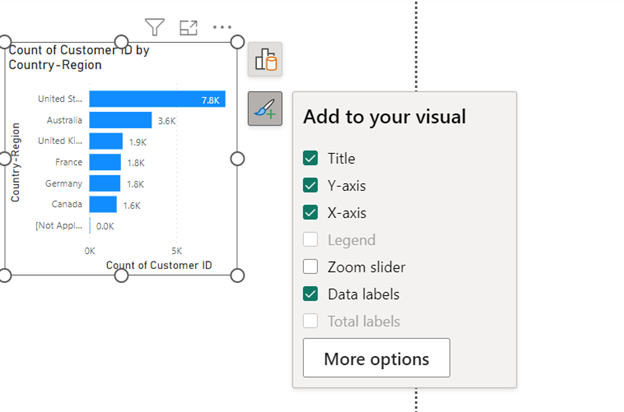
By clicking “More options,” you can access additional formatting features.
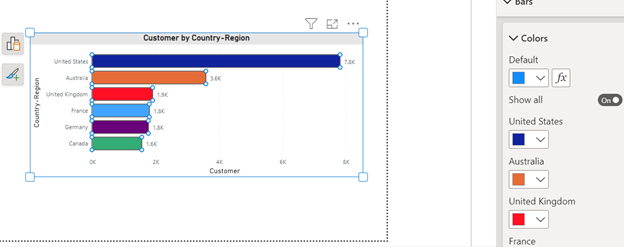
The on-object feature has addressed the challenge of users being unable to add data to the appropriate field wells and locate the relevant fields within the format pane for tasks such as renaming, modifying colors, or formatting text styles in their visualizations.
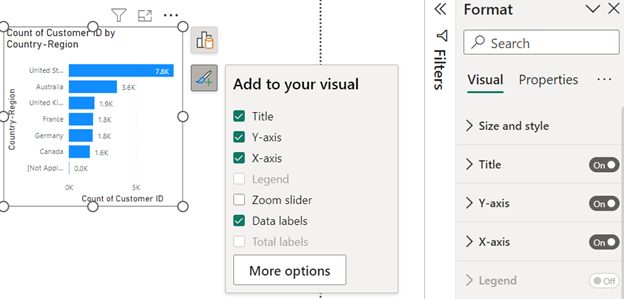
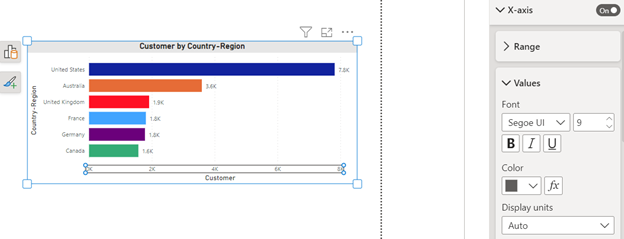
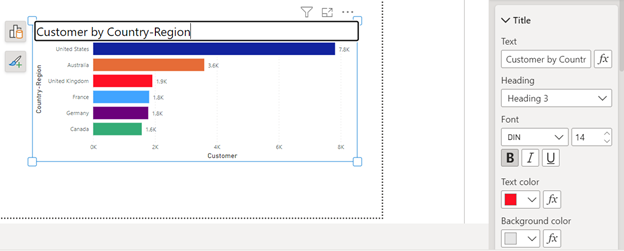
By clicking on visual elements, you can now directly modify the format of the visualization, as the corresponding fields are automatically displayed in the format pane.
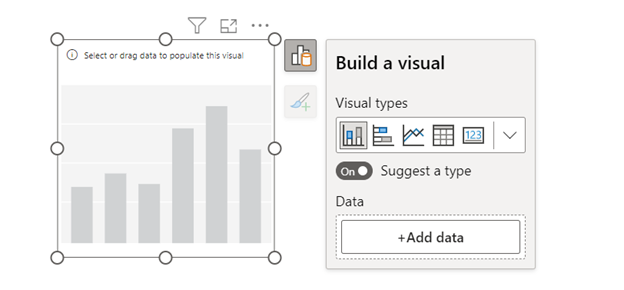
It also provides the suggestion for the type of visualizations based on the selected data. The “suggest a type” toggle is enabled by default, but it can be disabled from
File > Options and setting > Options> Report Setting> Uncheck Suggest a Visual by default
Here are some of the limitations of on-object features in Power BI:
Here are some of the limitations of on-object features in Power BI:
- The on-object feature supports limited visuals.
- The format mode is currently not supported in the mobile layout.
- The format mode is currently not supported in focus mode.
- Full accessibility support is not yet available, but it is expected to be implemented in the future.


Great features help the developer to build dashboard easily.