Power BI is a powerful business analytics tool that helps organizations visualize and share insights from their data. Two key components of Power BI are reports and dashboards. While they might seem similar at first glance, they serve different purposes and are used in distinct ways. Here’s a simple guide to understanding the difference between Power BI reports and dashboards.
Power BI Report
Definition: A Power BI report is a detailed, multi-page view into a dataset. It contains a collection of visualizations, such as charts, graphs, and tables, that represent different findings and insights from the data.
Creation: Reports are created using Power BI Desktop, a desktop application that allows users to connect to various data sources, transform data, and build visualizations.
Pages: Reports can have multiple pages, each filled with various visualizations. This multi-page structure allows for a comprehensive analysis of the data from different angles.
Data Source: A report can connect to one or more data sources, enabling a thorough examination of complex datasets.
Interactivity: Reports are highly interactive. Users can filter, slice, and drill down into the data within each report to explore and uncover detailed insights.
Purpose: The primary purpose of a Power BI report is in-depth analysis. It allows users to explore the data, identify trends, and derive insights through detailed visualizations.
Power BI Dashboard
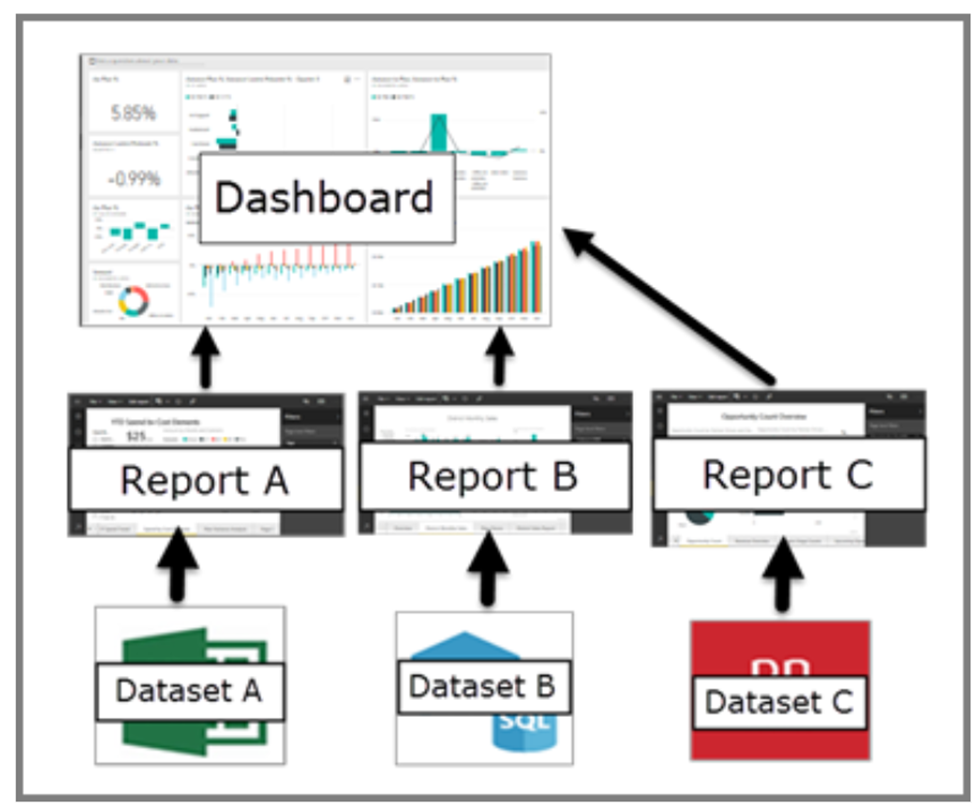
Definition: A Power BI dashboard is a single-page view, often referred to as a canvas, that consolidates key visualizations (tiles) from one or more reports to provide a high-level overview.
Creation: Dashboards are created and shared via the Power BI service (app.powerbi.com), where users can pin visualizations from different reports and datasets onto a single page.
Pages: Unlike reports, dashboards are limited to a single page, making them concise and focused on the most critical metrics.
Data Source: Dashboards can display data from multiple reports and datasets, allowing users to see a comprehensive summary in one place.
Interactivity: While dashboards offer some interactivity, such as the ability to refresh data and click through to the underlying reports, they are more limited compared to reports. The focus is on quick insights rather than detailed analysis.
Purpose: Dashboards are designed for at-a-glance monitoring and quick insights. They are ideal for tracking key performance indicators (KPIs) and trends, providing users with a snapshot of important metrics.
Conclusion
In summary, Power BI reports and dashboards are both essential tools for data analysis and visualization, but they serve different purposes. Reports are for detailed, multi-page analysis and exploration, while dashboards are for high-level, single-page summaries and monitoring. Understanding these differences can help users effectively utilize Power BI to meet their specific data analysis and visualization needs.
Read More:
Introduction to dashboards for Power BI designers
Overview Of Power BI And Its Important Features