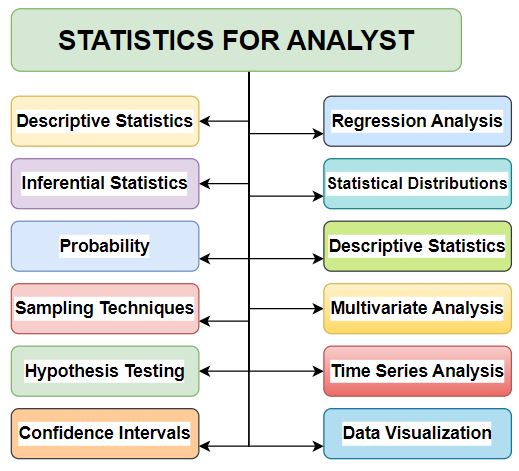
Understanding Statistical Analysis technique and concept helps the data analyst to unlock the potential of data-driven insights, make informed decisions, and effectively communicate findings through visual representations. Following are the some important statistical techniques.
Descriptive Statistics Analysis
Descriptive statistics involves summarizing and describing data using measures such as central tendency (mean, median, mode ) and dispersion (range, standard deviation). It provides a concise overview of data characteristics.
Inferential Statistics
Inferential statistics encompasses the process of drawing conclusions and making inferences by analyzing and interpreting sample data. It includes techniques such as hypothesis testing, confidence intervals, and estimation.
Probability
Probability is the measure of the likelihood of an event occurring. It provides a foundation for statistical inference and decision-making by quantifying uncertainty and randomness.
Sampling Techniques
Sampling involves selecting a subset of individuals / observations from a larger population. Different sampling techniques like random sampling, stratified sampling and cluster sampling, are used to ensure representativeness and generalizability of data.
Hypothesis Testing
Hypothesis testing is used to make inferences about a parameter based on sample data. It involves formulating a null hypothesis and an alternative hypothesis, collecting data, and using statistical tests to assess the evidence against the null hypothesis.

Confidence Intervals
Confidence intervals provide a range of values within which a population parameter is likely to fall with a certain level of confidence.
They help quantify the uncertainty associated with sample estimates and provide a range of plausible values.
Regression Analysis
Regression analysis examines the relationship between a dependent variable and one or more independent variables. It helps understand how changes in independent variables affect the dependent variable and allows for prediction and modeling.
Statistical Distributions
Statistical distributions describe the patterns and characteristics of data. Some of the Common distributions are the normal distribution, binomial distribution, Poison distribution, and exponential distribution. Understanding distributions is essential for many statistical analyses.
Statistical Tests
Statistical tests, such as t-tests, chi-square tests, ANOVA (analysis of variance), and correlation tests, are used to assess the significance of relationships, differences, or associations in data. They help determine if observed results are statistically significant or due to chance.
Multivariate Analysis
Multivariate analysis deals with the analysis of data that involves multiple variables simultaneously. Techniques such as factor analysis, cluster analysis, and principal component analysis are used to identify patterns, relationships, and groupings in complex datasets.
Time Series Analysis
Time series analysis focuses on analyzing data collected over time to identify trends, seasonality, and patterns. It helps in forecasting future values and understanding the dynamics of time-dependent data.
Data Visualization
Data visualization techniques, including charts, graphs, and plots, help present data in a visual format for easier understanding and interpretation. Effective data visualization enhances data exploration, communication, and storytelling.


