Introduction
Mastering Power BI: Study Guide for Certification Exams
Power BI is a powerful tool for data visualization and analysis. This guide covers key concepts and best practices related to data transformation, modeling, visualization, security, and optimization in Power BI. It serves as a study material for Power BI certification exams and professional use.

Data Transformation in Power Query
Reshaping Data
- Unpivoting Columns: Converts matrix-formatted data into a table with three columns (e.g., Year, Month, Sales Amount). This is useful when dealing with cross-tabulated or pivoted data.
- Pivoting Columns: Transforms row-based data into columnar format, which helps in structuring transactional data into a summary.
- Merging Queries: Use a Left Outer Join to keep all rows from the main table and include matching rows from the related table, ensuring complete records.
- Appending Queries: Combine multiple tables with the same structure to unify data from different sources.
- Grouping Data: Aggregate data using SUM, AVERAGE, or COUNT while maintaining structured categories.
Data Cleaning
- Use “Use First Row as Headers” if column names are not in the first row.
- Remove blank rows and errors to clean imported data and ensure accuracy.
- Change Data Types: Always assign the correct data type (e.g., Date, Currency, Whole Number) to improve efficiency.
- Replace Values: Standardize inconsistent data by replacing incorrect entries.
Data Modeling & Relationships
Creating Relationships
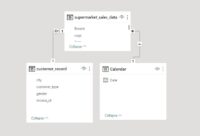
- One-to-Many (1:n): Used when a table with unique values (e.g., Customers) is related to a table with multiple entries (e.g., Orders).
- Many-to-One (n:1): Commonly used between a fact table (e.g., Sales) and a dimension table (e.g., Product).
- Many-to-Many (n:n): Only used when no clear hierarchy exists between tables, such as handling multiple sales channels.
- One-to-One (1:1): Rarely used, but applicable when two tables share the same unique identifiers.
Fact & Dimension Tables
- Store Sales Amount in the Fact Table (Sales Fact) instead of dimension tables.
- Use a Date Table to enable filtering and relationships across multiple tables.
- Optimize Fact Tables by reducing unnecessary columns and summarizing data.
- Keep Dimension Tables clean and well-structured for efficient lookups.
DAX Measures & Calculations
Aggregations
- Finding the Middle Value: Use
MEDIAN([ColumnName])for central tendency. - Calculating Last Known Value: Use
LASTNONBLANK()to retrieve the last recorded balance. - Ignoring Filters in Measures: Use
CALCULATE( AVERAGE( Table1[Item Price] ), REMOVEFILTERS( Table1[Region] ) )to calculate across all regions. - Summarizing at Different Levels:
SUMMARIZE()for grouping dataGROUPBY()for customized aggregationsSUMX()for row-level calculations
Performance Optimization
- Summarizing Large Data: Reduce the number of rows in large fact tables by summarizing at the required level (e.g., monthly instead of daily).
- Removing Unused Data: Delete old records or filter out inactive products to reduce model size.
- Optimizing DAX Expressions: Avoid using
FILTER()inside row-based calculations. - Using Variables (
VAR): Store calculated values to improve performance.
Row-Level Security (RLS)
Implementing RLS
- Filtering Data by User Email: Use
Employee[EmailAddress] = USERPRINCIPALNAME()to restrict access to individual sales records. - Assigning Security Groups: Use Microsoft Entra Security Groups to manage RLS access efficiently.
- Using Static vs. Dynamic RLS:
- Static RLS: Predefined filters (e.g., restricting region-based access)
- Dynamic RLS: Uses
USERPRINCIPALNAME()to match user credentials dynamically
Report Design & Visualization
Enhancing Reports
- Showing Additional Data on Hover: Add fields to the Tooltips Field Well.
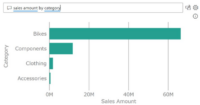
- Displaying Totals Above Bars: Enable Data Labels for clarity.
- Customizing Interactions: Use Edit Interactions and set filters appropriately (e.g., filtering a pie chart based on a selected bar chart item).
- Creating Tooltip Pages: Set the Canvas Setting to Tooltip to create dynamic pop-ups with contextual information.
Choosing the Right Visual
- Comparing Sales Across Countries: Use a Column Chart.
- Clustering Similar Data Points: Use a Scatter Chart.
- Summarizing Data in Tables: Use a Matrix visualization.
- Tracking Sales Trends Over Time: Use a Line Chart.
- Analyzing Contributions to Total Sales: Use a Waterfall Chart.
- Monitoring Performance Metrics: Use a Gauge Chart.
- Displaying Hierarchical Data: Use a Tree Map.
Power BI Service & Workspace Management
Managing Workspaces
- Publishing and Managing Reports:
- Contributor Role: Allows publishing reports and datasets but not managing permissions.
- Member Role: Grants the ability to add users and assign permissions.
- Admin Role: Full access to workspace settings and user management.
- Setting Up Scheduled Refresh: Keep data up to date by configuring refresh intervals in Power BI Service.
Performance Considerations
- Page Size Considerations: Large custom page sizes (e.g., 2500×3500 px) may require scrolling or zooming.
- Optimizing Report Load Time:
- Reduce the number of visuals per page.
- Optimize DAX measures.
- Limit the number of columns in datasets.
- Use Aggregations for high-volume datasets.
Power BI Exam Readiness Checklist
Key Areas to Review
✅ Understanding Power Query for data transformation
✅ Mastering data modeling concepts, including relationships and star schema
✅ Writing DAX measures for calculations and aggregations
✅ Implementing Row-Level Security (RLS) effectively
✅ Designing and optimizing Power BI reports for performance
✅ Managing Power BI workspaces and permissions
✅ Choosing the correct visualizations for different analysis scenarios
✅ Understanding Power BI Service features and best practices
✅ Optimizing large datasets and report efficiency
✅ Understanding DirectQuery vs. Import Mode and their impact
✅ Implementing Dataflows and using them for scalable ETL processes
Conclusion
This guide provides an overview of essential Power BI concepts, from data transformation and modeling to visualization and security. Mastering these topics will help you create efficient, interactive, and secure Power BI reports and prepare effectively for Power BI certification exams.
By following the best practices outlined in this study guide, you can optimize your Power BI workflows, improve report performance, and gain deeper insights from your data.
Read More:
Microsoft Power BI Data Analyst (PL-300 ) Exam Practice Questions and Answer
Microsoft Certified: Power BI Data Analyst Associate