Introduction
How to Run Python Scripts in Power BI Desktop
Power BI is a powerful data visualization tool, but sometimes, you need advanced analytics, automation, or custom data transformation. This is where Python scripting in Power BI comes in!
With Python, you can:
✅ Perform complex data transformations
✅ Fetch external data (e.g., stock market, web scraping, APIs)
✅ Apply machine learning models
✅ Generate advanced statistical visualizations
In this tutorial, we’ll go through the step-by-step process of installing Python, configuring it in Power BI, and running Python scripts inside Power BI Desktop.
Step 1: Install Python on Your Computer
Power BI requires Python to be installed on your system before you can run Python scripts.
Install Python
- Download Python from the official website:
👉 https://www.python.org/downloads/ - Run the installer and select:
✅ “Add Python to PATH” before clicking Install. - Wait for the installation to complete.
- Restart your computer after installation.
Step 2: Install Required Python Libraries
For Power BI to process data, you need the necessary Python libraries.
Install Required Libraries
- Open Command Prompt (CMD).
- Run the following command to install commonly used libraries:
pip install pandas numpy matplotlib seabornWe can install required library in a similar way; pandas is required for Power BI!
Step 3: Configure Python in Power BI
- Open Power BI Desktop.
- Go to File → Options & settings → Options.
- Scroll down to Python scripting (under “Global” settings).
- Click “Detect” or manually select your Python installation path.
- If unsure, check Python’s path by running:
where python5. Click OK and restart Power BI.


Step 4: Run a Python Script in Power BI
1. Open Power BI Desktop.
2. Click Home → Transform Data.
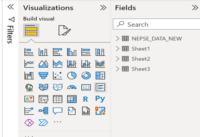
3. In Power Query Editor, click Run Python Script.

4. Enter this basic Python script to test:
import pandas as pd

# Create a simple DataFrame
df = pd.DataFrame({'Numbers': [1, 2, 3, 4, 5]})
df
5. Click OK, then Load Data to see the results.

Extract Real Data Using Python
Now, let’s fetch Yahoo Finance stock data and load it into Power BI.
import yfinance as yf
import pandas as pd

# Define stock symbol and date range
stock_symbol = "AAPL"
start_date = "2024-01-01"
end_date = "2025-01-01"

# Fetch data from Yahoo Finance
df = yf.download(stock_symbol, start=start_date, end=end_date)

# Reset index and select columns
df.reset_index(inplace=True)
df = df[['Date', 'Open', 'High', 'Low', 'Close', 'Volume']]

df

✅ Click OK → Load Data → Your stock data will now appear in Power BI! 🎉


Common Errors & Fixes
Error: “ModuleNotFoundError: No module named ‘pandas'”
🔹 Fix: Install the missing library using CMD
pip install pandasError: “Python script error: ADO.NET”
🔹 Fix: Ensure Power BI is using the correct Python path in File → Options → Python scripting.
Final Notes
✔ Python is required for Power BI scripting
✔ Install necessary libraries using pip install
✔ Set the correct Python path in Power BI settings
✔ Restart Power BI after making changes
Now, you can integrate Python + Power BI for advanced analytics! 🚀
Fore More: