Introduction
Power BI is a powerful business intelligence tool developed by Microsoft that used to analyze, visualize, and share data in an interactive and meaningful way. It has different Components . One of the key features that make Power BI highly versatile is its filtering capability.
Power BI provides a wide range of customizable visualizations such as charts, graphs, and maps. Users can easily create interactive dashboards and reports, enabling them to explore data and identify trends without coding skills.
Collaboration is facilitated through secure sharing of dashboards and reports, promoting real-time data sharing and informed decision-making across teams.
Data modeling capabilities in Power BI, including data cleansing and transformation, ensure accuracy and consistency in reporting. Users can shape and transform data using Query Editor and Data Modeling tools to meet their analysis requirements.
Integration with other Microsoft products and services, such as Excel, SharePoint, and Azure, enhances the value of existing data assets and streamlines workflows.
Microsoft Power BI is a comprehensive business intelligence tool with an intuitive interface, seamless data connectivity, customizable visualizations, collaborative features, robust data modeling capabilities, and integration with other Microsoft services.
With the Self-Service AI capabilities in Power BI Desktop, users can leverage machine learning algorithms and models without having to write complex code or rely on data scientists. This empowers business users to gain deeper insights from their data and make data-driven decisions more efficiently.
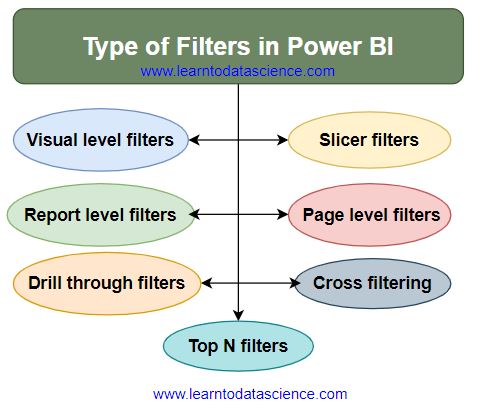
Filters in Power BI enable users to refine and focus their data analysis by selecting specific criteria or values.With a variety of filter types available, including visual-level, page-level, report-level, drill-through, cross-filtering, and slicer filters, users can tailor their reports to display the most relevant and insightful information.
types of filters in power BI

Visual level filters
These filters apply to a specific visual or chart in a report. Users can select specific values or range within a visual to filter the data displayed in that particular visual only. Visual level filters are ideal for isolating specific data points or segments.
Page level filters
Page level filters apply to an entire report page, affecting multiple visuals simultaneously. It enable users to control the data displayed across the entire page based on predefined conditions. This type of filter is useful when you want to maintain consistency and coherence throughout a report.
Report level filters
Report level filters allow users to set global filters that apply across all pages within a report. They provide a convenient way to filter data consistently across the entire report, ensuring that all visuals and charts reflect the same subset of data.
Slicer filters
Slicers are visual controls that allow users to select one or more values from a predefined list to filter data across multiple visuals. Slicers provide an intuitive way to interactively explore data by selecting specific categories or ranges
Drill through filters
Drill through filters allow users to create hierarchies or categories within their data and navigate through them to explore details. By right clicking on a data point, users can drill down to related information, applying filters dynamically to reveal additional insights.
Cross filtering
Cross filtering allows users to interactively filter data across multiple visuals or charts on a report page. When a user selects a value in one visual, all other visuals connected to the same data source are filtered accordingly, providing a synchronized view of data.
Top N filters
This filter type allows users to filter their data based on the top or bottom values of a specific measure. It helps to identify the highest or lowest performing entities or data points enabling users to focus on outliers or prioritize key insights.
Power BI filters offer a dynamic and interactive way to slice and dice data, enabling users to gain deeper insights and extract actionable intelligence from their reports.


