Jupyter Notebook is an open-source web application that allows you to create and share documents containing live code, equations, visualizations, and narrative text. Originally developed for interactive computing in Python, Jupyter supports various programming languages, making it a versatile tool for data science, research, and education
Jupyter Notebook Features Overview
Interactive Environment
Jupyter Notebook provides an interactive computing environment where you can write and execute code in a step-by-step manner, making it easy to experiment and iterate.
Support for Multiple Languages
While commonly used with Python, Jupyter Notebook supports various programming languages, including R and Julia, allowing you to work in a language that suits your needs.
Markdown Support
You can include formatted text, images, and hyperlinks using Markdown cells, making it an excellent tool for creating interactive documents with both code and explanations.
To create a Markdown cell, change the cell type from “Code” to “Markdown” in the Jupyter toolbar, or use the keyboard shortcut M when the cell is selected

Rich Output
Jupyter can display rich output such as tables, charts, and interactive widgets directly in the notebook, enhancing the presentation of your analysis.
Ease of Sharing
Notebooks can be easily shared with others, whether it’s via email, version control systems like Git, or platforms like GitHub.
Extensions and Plugins
Jupyter supports various extensions and plugins that enhance functionality, including code profiling, variable exploration, and more.
Integration with Data Science Libraries
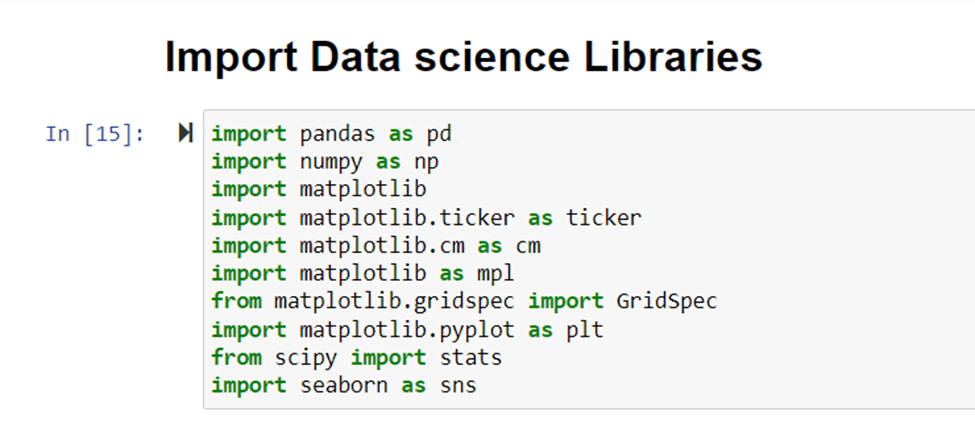
Jupyter seamlessly integrates with popular data science libraries, such as Pandas, Matplotlib, NumPy, and Scikit-Learn, making it a powerful tool for data analysis and machine learning.
Import Data Science Libraries
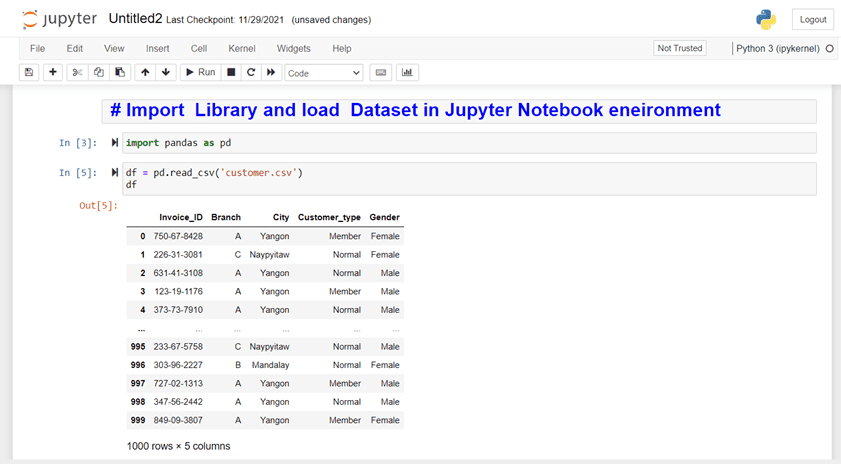
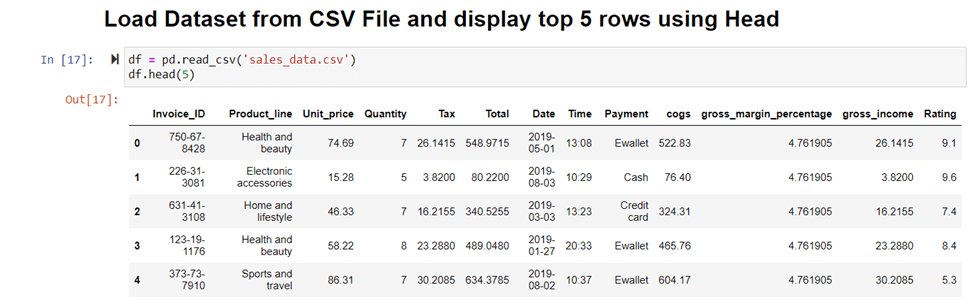
Load Dataset from CSV File and display
Count the Null / Missing Values
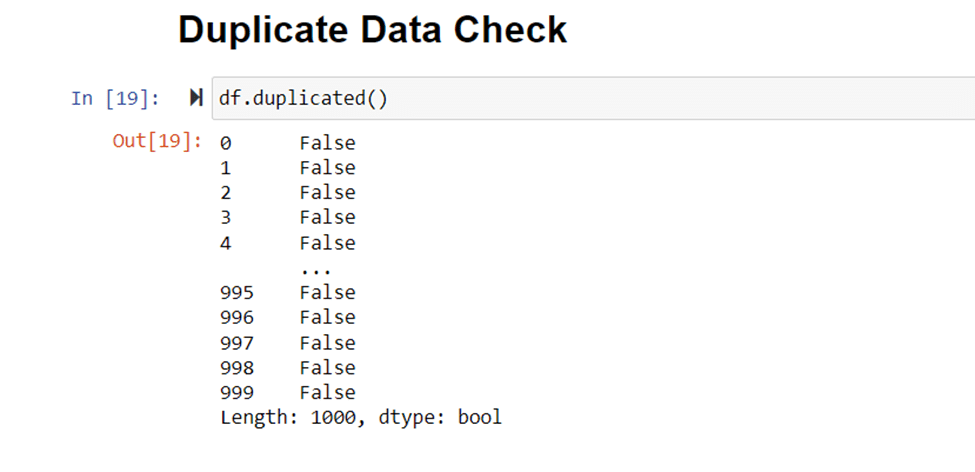
Data Duplication Check
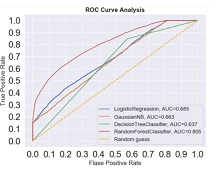
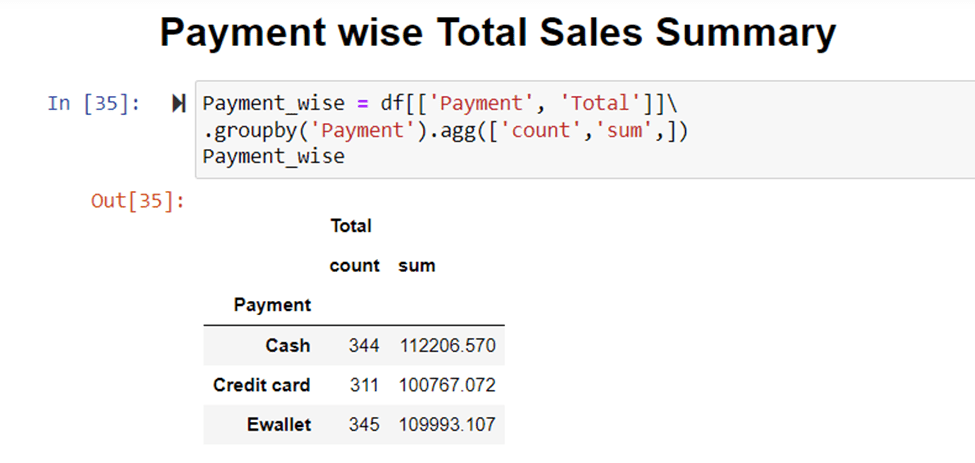
Data Visualization

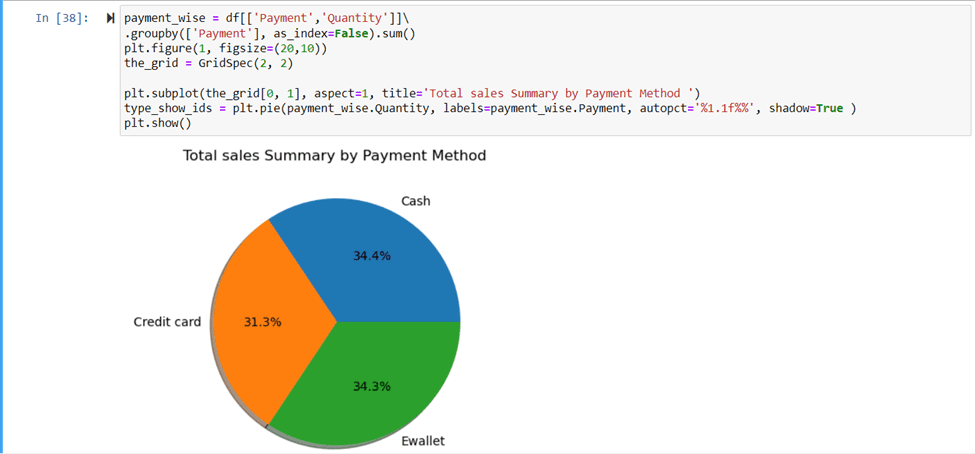
In the next tutorial, we will discuss more details in data analysis and visualization with different charts and summaries.
Read Also: Python Pandas for data analysis and Manupulation