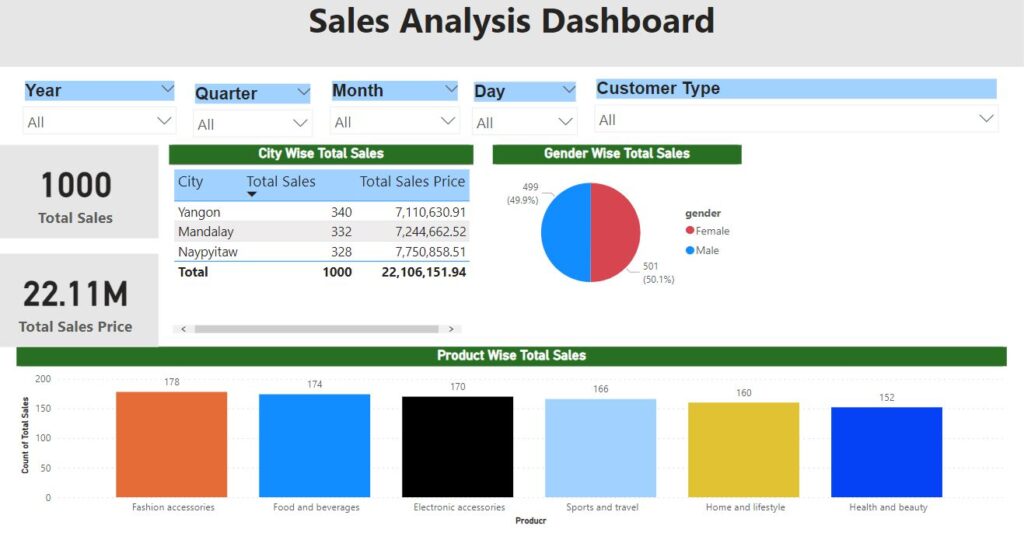
Power BI Desktop is a powerful data visualization and analysis tool that allows you to create interactive reports and dashboards. Dashboards are a great way to get an overview of your data at a glance, and Power BI makes it easy to create dynamic and interactive dashboards that can be customized to suit your needs.
Sample Power BI Dashbaord

Step 1: Connect to your data source
The first step in creating a dashboard is to connect to your data source. Power BI Desktop supports a wide range of data sources, including Excel spreadsheets, SQL Server databases, and cloud-based services like Google Analytics and Salesforce. To connect to your data source, click on the “Get Data” button in the Home tab of the Power BI Desktop ribbon.
Step 2: Import your data
Once you have connected to your data source, you can select the data that you want to use in your dashboard. Power BI Desktop provides a range of tools for importing and transforming your data, including data profiling, data cleansing, and data modeling. You can use these tools to ensure that your data is clean, well-structured, and ready for analysis.
Step 3: Create visualizations
Once your data is imported, you can start creating visualizations. Power BI Desktop provides a wide range of visualization types, including tables, charts, and maps. You can drag and drop fields from your data model onto the canvas to create visualizations, and then use the formatting options to customize the appearance of your visualizations.
Step 4: Add interactivity
One of the key features of Power BI Desktop is its ability to create interactive dashboards. You can add interactivity to your dashboards by creating slicers, filters, and drilldowns. Slicers allow you to filter data based on a particular field, while filters allow you to set more complex criteria for filtering data. Drilldowns allow you to navigate through hierarchical data structures, such as a product hierarchy or a geographical hierarchy.
Step 5: Publish your dashboard
Once you have created your dashboard, you can publish it to the Power BI service and Power BI report Serer. The Power BI service allows you to share your dashboard with others, collaborate on your data and analysis, and access your dashboard from anywhere. To publish your dashboard, click on the “Publish” button in the Home tab of the Power BI Desktop ribbon.
In conclusion, creating a dashboard in Power BI Desktop is a straightforward process that involves connecting to your data source, importing your data, creating visualizations, adding interactivity, and publishing your dashboard to the Power BI service. With Power BI Desktop, you can create powerful and interactive dashboards that can help you gain insights into your data and make more informed business decisions.
Download Sales Dashboard:
This dashboard helps you to understand how to import and transform data, create a calendar table using DAX, perform data modeling, and use different types of visualizations and charts (such as slicers, tables, pie charts, and bar graphs) to effectively present your data.


