Power Query, Power Pivot, And Power View Are Three Components Of Microsoft’s Power BI Suite, Which Is A Collection Of Business Intelligence Tools For Data Analysis And Visualization.
Power Query
Power Query is a data connectivity and transformation tool. it allows users to extract data from various sources, transform and clean it, and load Data (ETL) it into the desired destination (such as Power Pivot or Power View). Power Query provides a user-friendly interface for performing data shaping tasks, including merging, filtering, splitting, and pivoting data. It helps in preparing and refining data before analysis or visualization.
Power Pivot
Power Pivot is an in-memory data modeling tool. It enables users to create and manage data models that can handle large volumes of data efficiently. Power Pivot extends the data processing capabilities of Excel, allowing users to work with multiple tables, establish relationships between them, and define calculated columns and measures using the DAX (Data Analysis Expressions) language. By leveraging Power Pivot, users can perform advanced data analysis, create complex calculations, and build interactive reports and dashboards.
Power View
Power View is a data visualization tool. It enables users to create interactive reports and visualizations based on the data models built with Power Pivot. Power View provides a range of interactive visual elements, such as charts, tables, matrices, and maps, which can be customized and combined to create compelling and insightful reports. Users can interact with the visualizations, filter data, drill down into details, and create dynamic presentations to explore and communicate data effectively.
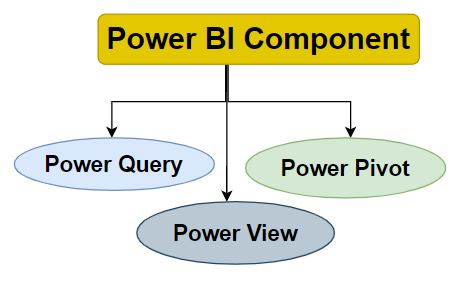
These three components work together to provide a comprehensive solution for data integration, modeling, and visualization within the Power BI ecosystem. They are designed to empower users to extract insights from their data and create absorbing visualizations and reports for decision-making purposes.
Power BI Components in Excel
We can use Power Query, Power Pivot, and Power View features within Microsoft Excel with some limitations. These features are available in certain versions of Excel and can be accessed through the “Power Query,” “Power Pivot,” and “Power View” tabs in the Excel ribbon.
Power Query in Excel
In newer versions of Excel (2010 and later), Power Query is integrated as a built-in feature called “Get & Transform.” It allows you to connect to various data sources, perform data transformations, and load the data into Excel. You can access Power Query from the “Data” tab in the Excel ribbon.
Power Pivot in Excel
Power Pivot is an add-in that needs to be enabled separately in Excel. It provides advanced data modeling capabilities, allowing you to import and link multiple data sources, create relationships between tables, and perform complex calculations using DAX (Data Analysis Expressions) formulas. You can enable the Power Pivot add-in from the “COM Add-ins” section in Excel’s options.
Power View in Excel
Power View is a data visualization tool that was introduced in Excel 2013 but was removed in later versions. However, you can still create similar visualizations using other Excel features like PivotTables, charts, and slicers. While Power View is no longer available in newer versions of Excel, you can still use its capabilities through other built-in tools.
Frequently Asked Questions (FAQs)